





Gluten free sits on 703 products across the US plant-based shelf. Over the two years to July 2026, the same claim’s relevance to plant-based shoppers fell by 36.4%. The shelf is holding space for a claim those shoppers are drifting away from. Refined sugar free, the one claim in that set still gaining ground, does not appear among the eight most common claims on that shelf at all.
Closing that gap is the whole job of shopper insights. Range decisions get made on a picture of demand, and when the picture is a year old the range inherits the lag. This guide covers what shopper insights are, how they differ from consumer insights, and how real-time retail data converts into assortment calls you can defend in a line review.
Key takeaways
- Shopper insights describe how, when, and why people select products at the point of purchase, across physical and digital shelves.
- Consumer insights explain attitudes and usage. Shopper insights explain the purchase trigger, the channel, and the path to the shelf. Range decisions need the second kind.
- The US plant-based shelf spans 168 sales categories and 153 retailers, so a single assortment decision touches far more shelf contexts than a category review usually models.
- Claim footprint and claim demand move at different speeds. Dairy free holds 550 SKUs and took 24 recent launches while its consumer signal fell 17.2%.
- Channel changes the answer. Walmart carries 2,325 of the tracked plant-based SKUs at $9.18 average, against $5.14 on DoorDash for the same category.
- Where new products actually get in varies sharply. Recent launches make up nearly 1 in 7 of the Sprouts plant-based assortment (15%) and 3.0% of Walmart’s.
What are shopper insights and why are they critical for range planning?
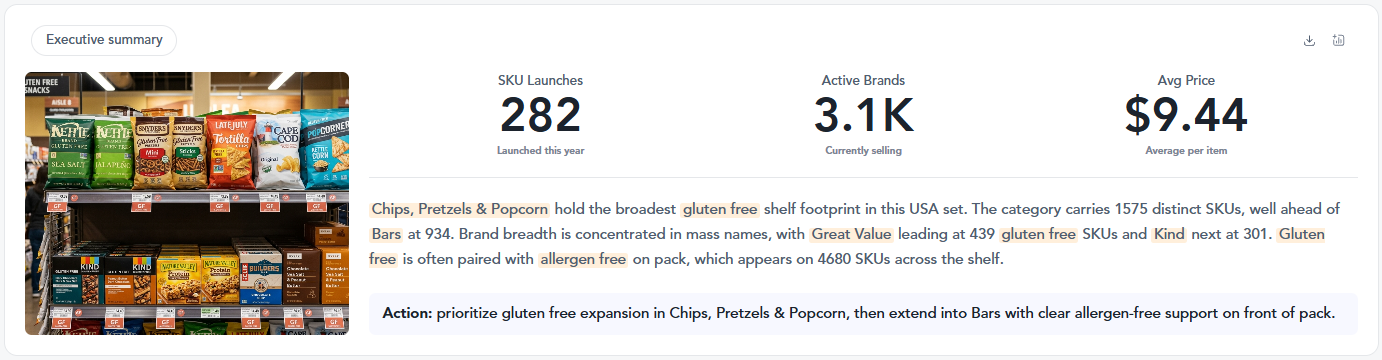
Shopper insights are the data and behavioral patterns that capture how, when, and why people select specific products at the point of sale, across physical and digital channels. Applied to range planning, they let you retire poor-performing SKUs, argue for shelf space, and match availability to live buyer intent rather than to last year’s plan.
The shopper insights definition matters because the alternative is planning against a proxy. Category reviews often run on what sold, which describes a shelf that already existed. Shopper insights research describes the decision that produced the sale, which is the part you can act on when deciding what to list next.
Scale is the reason this gets hard. In the US, plant-based products alone span 168 sales categories and reach across 153 retailers. A claim that performs in one of those contexts can sit dead in another, and a range decision taken at brand level quietly averages across all of them.
Shopper insights vs consumer insights
Consumer insights cover general attitudes, usage habits, and the reasons people say they eat what they eat. Shopper behavior insights cover the purchase itself: the trigger, the channel preference, the substitution made when the first choice is out of stock, and the in-store or online path to the shelf.
The distinction has a practical edge. Consumer and shopper insights can point in different directions at the same moment, and the plant-based shelf is a clean example. Its claim architecture is built around dietary identity, with plant based on 3,309 SKUs and vegan close behind on 3,210. Yet every recently launched product on that shelf is selling function instead of identity. Koia’s +Creatine Plant-Based Strawberry Shake leads with creatine. Blue Diamond Chocolate Protein Almondmilk leads with protein, priced at $4.28 and rated 4.7 across 342 reviews. TRUBAR’s Cherry on Top bar carries plant-based protein on the front of pack at $7.86.
Read only the consumer layer and you conclude that identity claims own the category. Read the shopper layer and you see the products people are actually adding to baskets have moved on to a different benefit. Assortment built on the first reading defends a taxonomy. Assortment built on both reads the direction of travel.
Addressing retail shopper insights across channels
Grocery shopper insights, convenience store shopper insights, and online grocery shopper insights describe genuinely different shelves, and treating them as one shelf is how brands lose sales they had already earned.
The concentration in the data is stark. Walmart carries 2,325 of the tracked plant-based SKUs. Kroger carries 89 and Publix 71. A category story tuned to conventional supermarkets is therefore tuned to a fraction of where the volume sits, and the wider spending data agrees. According to the USDA Economic Research Service, warehouse clubs and supercenters grew from 9.4% of US food-at-home spending in 1997 to 26.4% in 2025.
Two independent sources reach the same conclusion from different methods. Shelf data shows where the SKUs are. Federal spending data shows where the dollars went. Both say a grocery-shaped view of the market now uses the wrong denominator. The channel picture sharpens further when grocery analytics sit alongside the packaged and prepared split visible in convenience food trends, because the two channels restock and refresh on different clocks.
How do advanced analytics engines convert retail data into actionable range strategies?

An enterprise shopper insights platform earns its place by turning unstructured consumer signal into an assortment recommendation fast enough to act on. The work is less about collecting more data and more about resolving it to the level a decision gets made: this claim, in this channel, at this retailer, this quarter.
The volumes involved make the case for automation on their own. Across the plant-based shelf, 74 SKUs launched in a twelve-month window against a standing base of 3,299 products. Tracking that by hand across 153 retailers is not a research project anyone finishes before the range review.
Streamlining assortment execution
Pairing shopper and category insights with automated data pipelines replaces a periodic study with a continuous read. Traditional shopper insights research produces a snapshot, and snapshots age. A self-serve platform lets a category team re-run the same question when a buyer asks it, which is usually the week before the meeting rather than the quarter before.
What that continuity surfaces is where new products actually get shelf space. Sprouts Farmers Market carries 100 plant-based products and 15 of them are recent launches. Walmart carries 2,325 and 70 are recent launches. New products are therefore nearly 1 in 7 of the Sprouts range (15%) and 3.0% of Walmart’s. If you are launching, those two numbers imply completely different sell-in sequences, and neither is visible in a brand-level demand figure. The same logic applies when you evaluate category management software against what a line review actually asks you to prove.
Brand case scenario: plant-based range expansion
Here is how the sequence runs with real figures from the US shelf.
A plant-based brand wants a wider listing. Step one is finding the claim with room in it. On the current shelf, organic carries 568 SKUs at a $10.45 average price while dairy free carries 550 at $6.59. Similar footprint, very different price architecture, so the two claims support different range arguments.
Step two is checking demand direction rather than demand level. Vegetarian holds 275 SKUs on shelf, and its consumer signal fell 51.8% over the two years to July 2026. That is a claim to trim, whatever its current footprint. Refined sugar free moved the other way, gaining 5.6% and standing as the only riser in the set, with no presence among the shelf’s leading claims.
Step three is naming the channel. Given how launches concentrate, the brand pitches a refined-sugar-free line into Sprouts first, where new products reach shelf at five times the rate they do at Walmart relative to assortment size. The proof points travel with it: an unserved rising claim, an established price band from the dairy free set, and named comparables already selling function, such as Califia Farms Complete Original Plant-Based Milk and Gardein’s Ultimate Plant-Based Breakfast Saus’ge.
Step four is the follow-on. Once velocity exists in a specialty account, the same evidence supports the supercenter conversation, where the 2,325-SKU footprint means the listing competes on a much longer shelf.
Why modern CPG brands need unified consumer shopper insights

Cross-channel visibility is what separates a shopper insights platform from a reporting tool, and it is the reason to look hard at any provider list before committing. When evaluating the best shopper audience insights providers 2026 has on offer, the question worth asking is whether the same signal resolves to both a claim decision and a channel decision, or whether those live in two systems that disagree.
Breaking down siloed shopper behaviour insights
Batch data hides movement between refreshes. Integrated consumer and shopper insights surface flavor, ingredient, and packaging demand while there is still time to reformulate.
The cost of the lag is measurable on the current shelf. Dairy free holds 550 SKUs and took 24 recent launches while its consumer relevance fell 17.2%. Natural holds 253 SKUs and took 2 launches on a 19.2% decline. Both claims are still absorbing innovation investment as their pull weakens, which is exactly the decision a quarterly refresh cycle makes invisible. Aligning what marketing reads with what category management reads is the fix, and AI retail optimization covers how brands wire those two teams to one signal layer.
One caution on reading claim data of this kind. Direction of travel is the dependable part. A single claim’s share of conversation reflects how often it co-occurs with a topic, so treat the ranking and the trend as the signal and leave population-level reach to a modeled panel.
Dynamic range optimization for omnichannel retail
Shoppers move between an app and an aisle inside one purchase, so assortment decisions have to be synchronized across both. Price is where the lack of synchronization shows up first.
Inside the same plant-based category, Walmart’s average pack runs $9.18 against $5.14 on DoorDash, roughly 79% higher. That is one category, two channels, two different value expectations. A single national range decision, applied flat, will misprice in one of them. Working from unified retail shopper insights lets pack size, claim hierarchy, and price band flex by channel while the assortment logic stays consistent, which is the practical version of what retail category insights are for at account level.
The same pattern shows up in how shoppers behave inside a single trip, where value logic and indulgence sit in one basket. That behavior is covered in more depth in supermarket food trends, and the wider commercial backdrop in this guide to CPG retail.
Turning the signal into a range decision
The gap the data keeps showing is a timing gap. Claims hold shelf space after their pull has weakened, rising claims arrive on shelf late, and channel differences get averaged away. None of that requires better instincts to fix. It requires reading the shelf and the shopper on the same clock, then acting on the difference while it is still a difference.
Start with one claim, one channel, and one retailer. Check whether the footprint and the direction agree. Where they disagree, you have found your range decision.
Frequently asked questions about shopper insights
Shopper insights are the data and behavioral patterns describing how, when, and why people choose specific products at the point of purchase, across stores and digital shelves. They cover the purchase decision itself rather than general food attitudes.
In practice they combine claim performance, channel availability, price position, and launch activity. On the US plant-based shelf, that means reading 695 brands and an $8.50 average price alongside where each product is actually stocked.
Consumer insights explain attitudes, preferences, and usage habits. Shopper insights explain the purchase trigger, the channel chosen, and the path taken to the shelf.
The two can disagree, which is the useful part. Vegetarian still holds 275 products on the plant-based shelf while its consumer signal fell 51.8% over the two years to July 2026, so attitude data and shelf data point different ways.
They replace a demand assumption with a demand reading at the level the decision gets made, meaning claim, channel, and retailer rather than brand or category average.
That resolution changes outcomes. Costco carries 287 plant-based SKUs with 14 recent launches while Aldi carries 70 with 1, so the same national listing plan lands very differently in each.
Yes, substantially. Grocery, convenience, club and online shelves each carry their own assortment breadth, refresh speed and price expectation.
The USDA Economic Research Service records non-food retailers such as drugstores and dollar stores taking 11.1% of US food-at-home sales in 2025, which is shelf space most category plans never model.
It is a system that resolves consumer and retail signal into assortment, pricing, and channel recommendations on demand, rather than delivering a periodic study.
The test is whether you can re-run a claim question against a specific retailer the week a buyer asks it. Tracking 74 launches a year across 153 retailers is not work that a manual refresh cycle keeps up with.
Often enough to catch a claim turning before the innovation spend commits, which in practice means continuously rather than at an annual reset.
The plant-based shelf shows why. Gluten free took 9 recent launches while its consumer relevance dropped 36.4%, a divergence an annual cycle would have missed for three quarters.



We’d love to learn your goals and see how Tastewise fits
We’d love to learn your goals and see how Tastewise fits
Get a personalized demo
Good taste. Wise move.
Your demo request is confirmed. We’ll reach out within one business day to schedule your walkthrough.
What happens next

See what’s driving demand, then turn it into a sell-in story for retailers and operators.
- Connect consumer panels, market trackers, and agents into one evidence view
- Get the “why” behind what’s changing, with explainable demand drivers
- Walk away with a buyer-ready narrative and next steps to activate
Trusted by





“Tastewise is my secret tool for knowing what consumers want next and why.“