






Restaurant chain growth data for foodservice sales teams
See which of the 32,768 restaurant chains in the US are opening locations, which are closing them, and which are worth your next pitch.
Trusted by 80% of the world’s leading food & beverage brands · since 2018











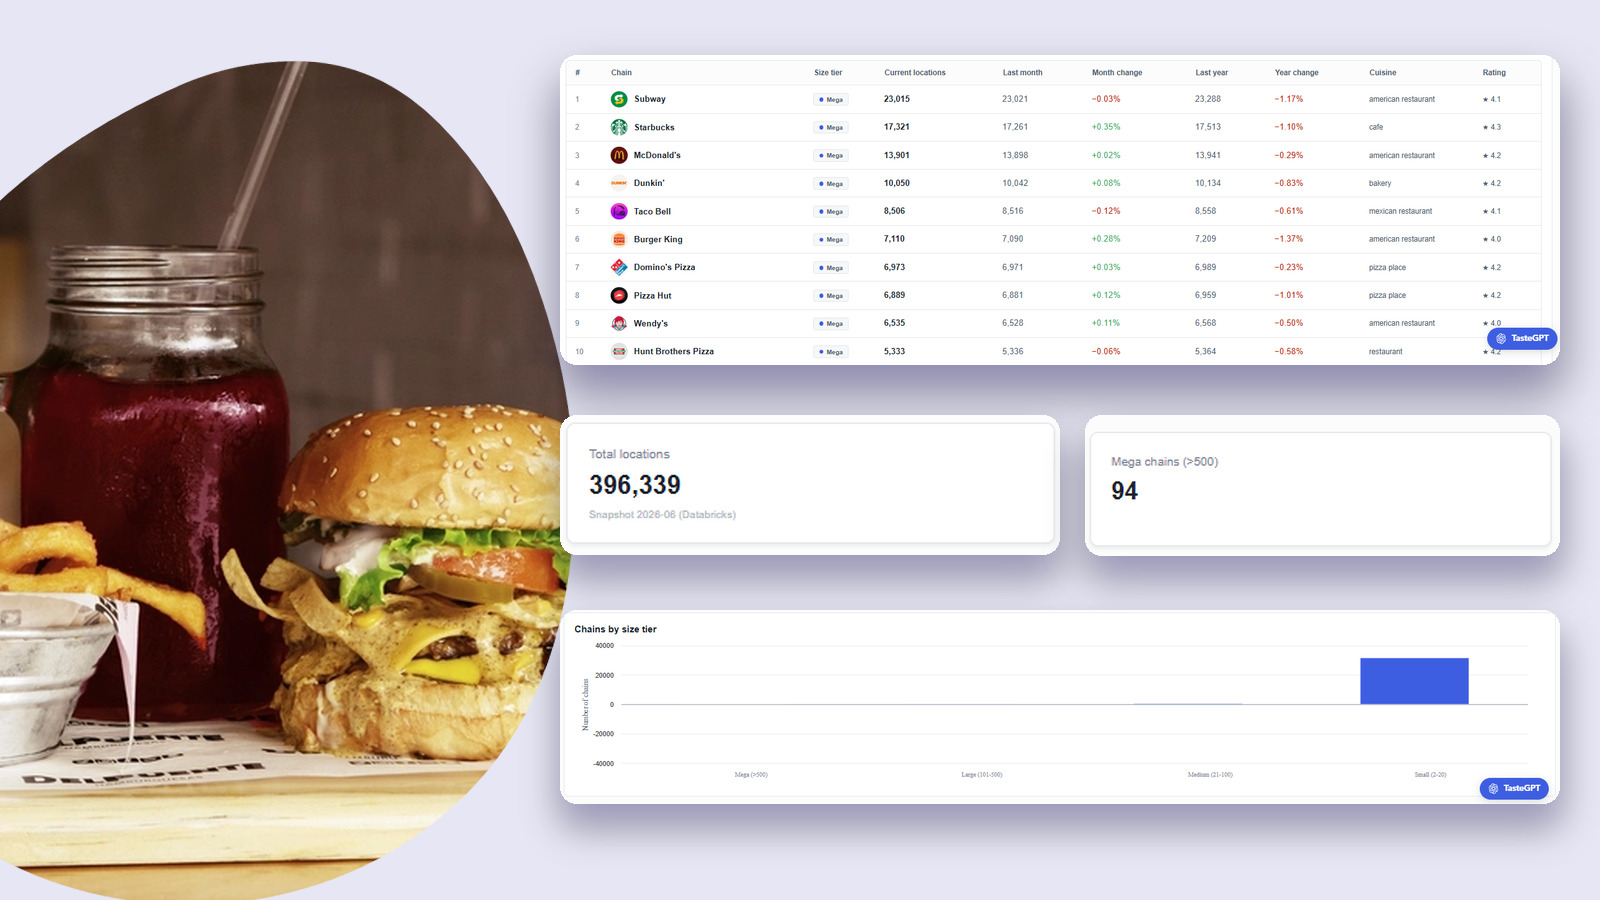
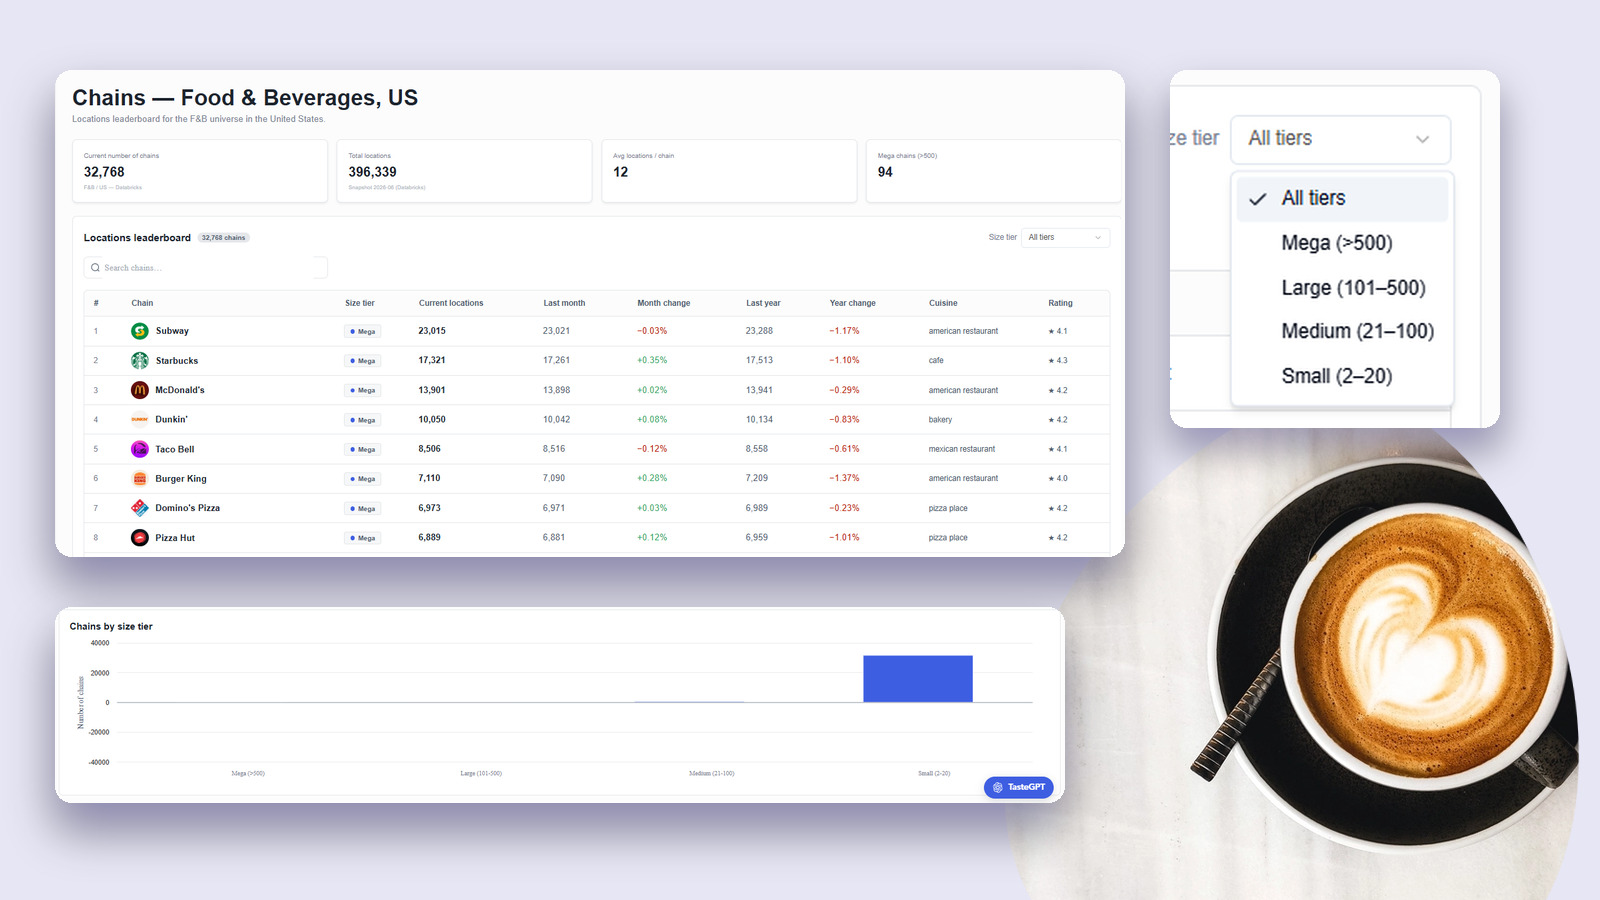
Domino’s and Pizza Hut are both net openers this month while the pizza tier gives ground over 12 months
Domino’s sits at 6,973 locations, up 0.03% on last month. Pizza Hut sits at 6,889, up 0.12%. Hunt Brothers Pizza went the other way at 5,333, down 0.06%. All three are below where they were a year ago, so the openings are concentrated, not general.
What restaurant chain growth data changes for your team
Four things your account planning gets that a store count from a press release cannot give you.
Direction, not just size
Every chain shows its count now, last month and last year, so you can tell a net opener from a chain coasting on scale.
Tiers you can sell to
Four size tiers from mega above 500 locations down to small at 2 to 20, so coverage decisions match the account, not the average.
One ranked pitch list
A single leaderboard of 32,768 US chains replaces the spreadsheet each rep rebuilds by hand every quarter.
A refresh you can plan around
A monthly snapshot means the territory plan you write in July is still describing the market in August.
The restaurant chain growth data behind every answer
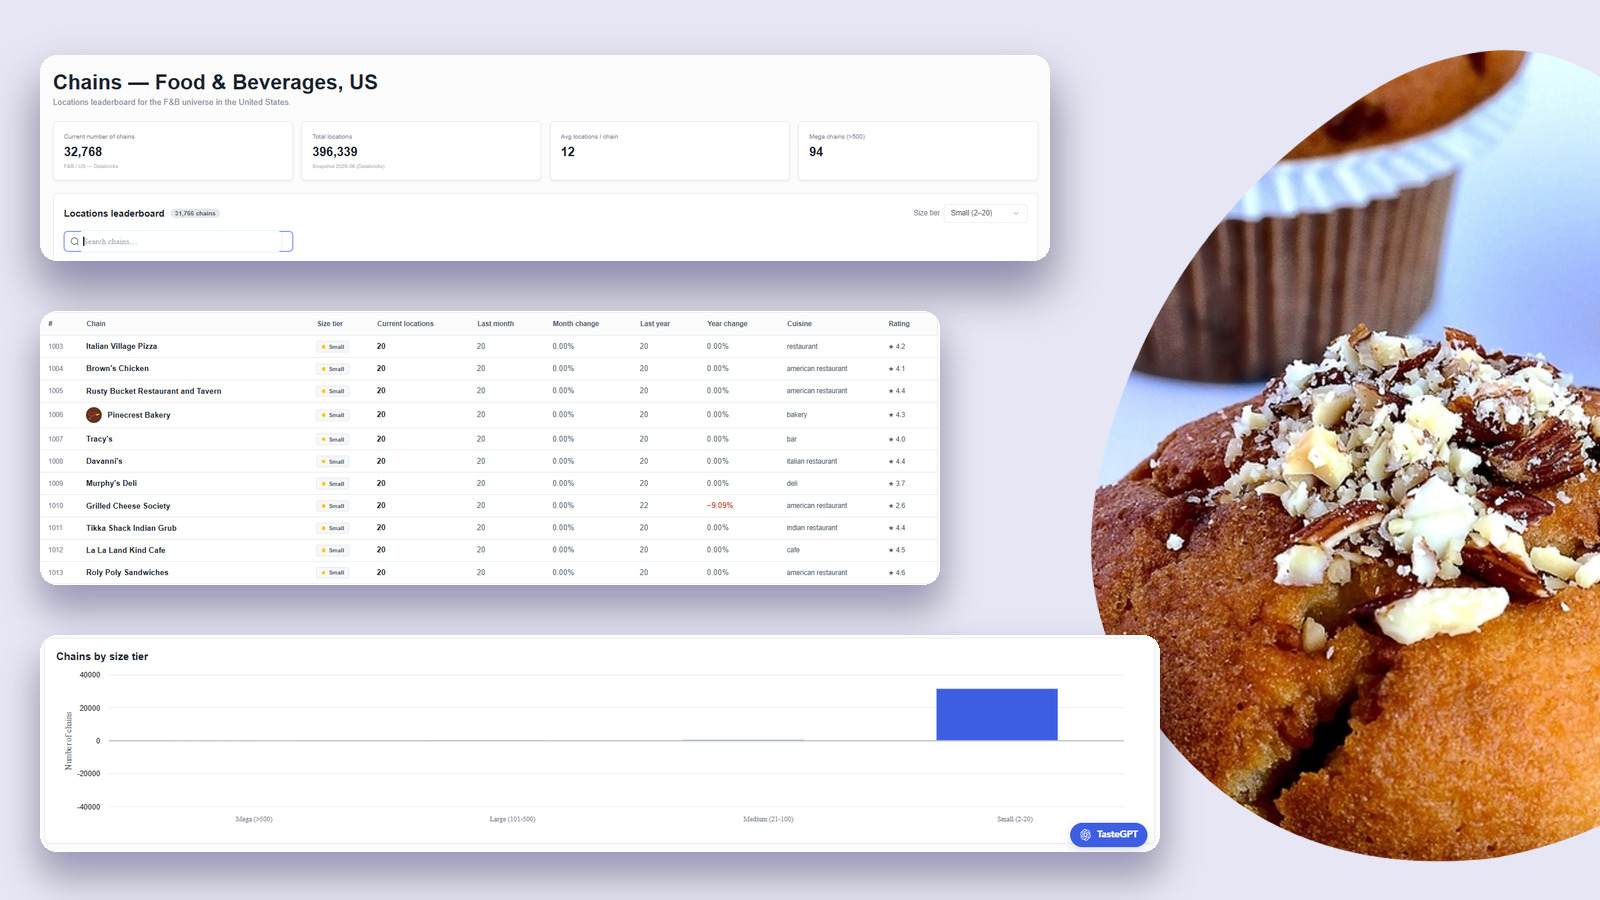
Chain Growth Hub reads the Tastewise US food and beverage chain universe, currently 32,768 chains covering 396,339 locations, at 12 locations per chain on average. Every chain is counted against the same definition each month, which is what makes the month change and the 12 month change comparable across the whole set.
The restaurant chain growth data set
How restaurant chain growth tracking works
Three steps from the chain universe to a pitch list you can hand a rep.
Set your chain universe
Filter the leaderboard to the tier, cuisine and market you sell into.
Read the growth direction
The agent compares the current count against last month and against the same month last year.
Take the ranked list out
You get chains ordered by the movement you asked about, each with its tier, cuisine and rating attached.
Restaurant chain growth data, or a store count you assembled yourself?
Without Tastewise’s Chain Growth Data
- Counts scraped from press releases and franchise filings
- A number with no direction attached
- Every chain treated as one flat target list
- Cuisine guessed from the fascia
- A territory plan built on last year’s list
With Tastewise’s Chain Growth Data
- One monthly count across 32,768 US chains and 396,339 locations
- Last month and last year beside the current count, so direction is visible
- Four size tiers, from 94 mega chains down to 31,766 small chains
- A cuisine tag and a consumer rating on every chain in the leaderboard
- A dated snapshot, so the plan and the market describe the same month
How brands shaping modern F&B decisions use Tastewise
From a chain list rebuilt each quarter to a ranked one
Account priorities argued from the last conference conversation.
Chains ordered on net openings, with tier and cuisine already attached.
From blanket coverage to coverage that pays back
The same call pattern applied to a 600 site chain and a 12 site chain.
Effort weighted by tier, against a set where the average chain runs 12 locations.
From chain count to location weight
Opportunity sized by how many chains serve the category.
Opportunity sized by locations, where the top ten chains alone hold 105,633 sites.
More AI agents for food & beverage teams
The rest of the foodservice stack, from the operator pitch to the menu concept.
Marketing Agent
Build data-backed marketing strategies grounded in real consumer behavior and trend signals.
TradeShow Intelligence
Track competitor launches, innovation themes and buyer signals from industry events.
LTO Innovator
Design limited-time offers optimised for menu impact and consumer excitement.
Brand Navigator
Map brand portfolio health, competitive positioning and white space at a glance.
Blog Post Creator
Produce SEO-ready food editorial content backed by real trend and consumer signals.
Product Visualizer
Generate AI-rendered product imagery for concepts and campaigns before production.
Foodtok Growth Signals
Capture viral TikTok food moments and translate creator trends into activation ideas.
Recipe Innovation
Develop trend-grounded recipe concepts tuned for operator and retail channel fit.
Synthetic Survey Agent
Runs panels on-demand to validate concepts with target audiences.
Ready to see this agent in action?
80% of leading food brands use Tastewise to turn signal into revenue. Book a session and get Chain Growth Hub built around your product and your target accounts.
FAQ
What is restaurant chain growth data and what does Chain Growth Hub track?
It is a monthly location count for every chain in the Tastewise US food and beverage universe, currently 32,768 chains across 396,339 locations. Each chain carries its current count, its count last month, its count a year ago, the change on both, a size tier, a cuisine tag and a consumer rating.
How current is the restaurant chain growth data?
The leaderboard runs on a monthly snapshot, and the one live in the platform is June 2026. Because every chain shows now, last month and 12 months ago, you can separate a chain that added four sites in the last month from one that is a few hundred sites down on last year.
Which are the largest restaurant chains in the restaurant chain growth data?
Subway leads on locations at 23,015, then Starbucks at 17,321 and McDonald’s at 13,901. Dunkin’ and Taco Bell complete the top five at 10,050 and 8,506. The top ten chains together hold 105,633 locations, a little over a quarter of the 396,339 in the US set.
Can I find the fastest growing restaurant chains in the restaurant chain growth data?
Yes. Sort on the month change or the 12 month change to separate net openers from net closers. Filter by size tier first, because a small chain going from 20 sites to 22 reads as a 10% gain while a mega chain adding 60 sites moves less than a percent.
How is restaurant chain growth data different from asking a general AI which chains are growing?
A general model answers from whatever it happened to read, with no snapshot date and no way to check the figure. Chain Growth Hub answers from a dated count of 32,768 chains with last month and last year beside it. Every run is traceable and every output citable.
Is the restaurant chain growth data enterprise ready?
Yes. It sits on the same foundation as the rest of the platform, 1T+ structured food and beverage data points and 4M+ tracked foodservice locations across 38 live markets. Every agent run is traceable, every output citable and every decision auditable.
Who uses restaurant chain growth data inside a supplier?
National account teams use it to rank which chains to approach. Route to market and distributor teams use the size tiers to decide where coverage pays back. Menu and category teams use it to weight opportunity by locations rather than by chain count.





