






Consider two entries in the same beverage category. Across the Tastewise US consumer panel, matcha carries 67.09 social share and grew 7.3% over the past year. Green tea carries 25.69 and fell 36.2%. Both appear on 6.50% of US menus. They come from the same plant.
If your sentiment analysis tool tracks the category label “green tea,” it tells you the category is collapsing. If it tracks “matcha,” it tells you the category is healthy. Both readings come from the same leaf, and neither is useful on its own. These are conversation-level buzz figures rather than consumer adoption counts, which matters for how you act on them.
That gap is the reason the market for sentiment analysis tools has split. General-purpose platforms score polarity across every industry at once. Category-native platforms interpret what the words mean inside one industry. For food and beverage teams, the second question is the one that changes a product decision.
Key takeaways
- Matcha and green tea come from the same plant and move in opposite directions. Matcha holds 67.09 social share and grew 7.3% over the past year. Green tea holds 25.69 and fell 36.2%. Both sit on 6.50% of US menus.
- A category-level average can hide everything that matters. Inside matcha, cloud formats rose 94.0% while iced matcha lattes fell 37.4%. The headline reads plus 7.3%, sitting between framings 130 points apart.
- Polarity scoring tells you how people feel and rarely why. Health language fell sharply, with healthy down 45.1% and weight management down 62.1%. Over the same window intentional rose 162.0% and ritual rose 67.7%, while sentiment stayed broadly positive.
- Conversation volume and share of conversation can move in opposite directions. Total posts rose 26.7% across these drinks even as most individual ingredients lost share. Read both before you act on either.
- Your tool choice follows your data source. General platforms handle brand reputation and support well. Menu, shelf and product decisions need a tool that reads menus rather than mentions.
What is sentiment analysis and why is it important for business growth?
Sentiment analysis is the automated processing of natural language data to classify expressed emotion as positive, negative or neutral. Sources include reviews, social posts, survey responses and menu feedback. A dedicated tool for sentiment analysis converts qualitative feedback into metrics your team can track over time.
The business case is straightforward. Feedback arrives faster than any team can read it. Sentiment analysis software gives you a repeatable way to detect direction of travel across thousands of comments, which is why it sits inside most modern food consumer insights programs.
The limitation matters as much as the benefit. Polarity tells you how people feel. It rarely tells you why, and the why is what your R&D and marketing teams need.
How does an AI sentiment analysis tool decode customer emotion?
An AI sentiment analysis tool works in layers. Natural language processing breaks text into tokens and identifies grammatical structure. A trained model then assigns contextual scores, weighing negation, intensity and position. Better systems handle sarcasm, comparatives and industry vocabulary that would confuse a general model.
Domain vocabulary is where most tools struggle in food. Consider the framings inside matcha over the past year. Matcha cloud rose 94.0% and banana matcha rose 47.6%. Over the same window matcha latte fell 19.8% and iced matcha latte fell 37.4%. The aggregate reads plus 7.3%, an average sitting between framings that moved 130 points apart.
A text sentiment analysis tool scoring the token “matcha” returns one positive number for all of it. Your innovation team needs to know that the cloud format is climbing while the standard latte format is falling. That distinction lives in food vocabulary, not in general language models.
Which industries benefit most from online sentiment analysis?
Retail and service brands use online sentiment analysis to catch friction in support interactions and reviews, then route recurring complaints to the responsible team. The output is operational.
Food and beverage brands need something different. Menu and recipe language carries meaning that generic models flatten. Menu penetration data shows hojicha at 4.10% of menus growing 24.4%, and cold foam at 2.00% growing 24.0%. Those are execution signals a chef or category manager can act on this quarter, and they only surface when the tool reads menus rather than mentions.
Foodservice operators run the same analysis against a different data set. Sentiment across delivery platform reviews behaves differently from sentiment on social, which is why restaurant data collection methods vary by channel. Seasonal patterns add another layer, and seasonal food consumer insights show demand cues shifting away from fixed calendars.
What sentiment analysis misses when it only reads polarity
Here is the finding that should change how you evaluate sentiment analytics tools.
Across the same matcha and green tea data, the claims consumers attach to these drinks have inverted. Health framing fell hard. Healthy language dropped 45.1%, detox dropped 46.0%, weight management dropped 62.1% and antioxidants dropped 36.9%. Tea time as an occasion fell 60.9%.
Over the same period, experience framing surged. Intentional rose 162.0%, slow living rose 86.5%, ritual rose 67.7%, smooth rose 37.5% and cozy rose 31.4%.
Polarity scoring registers almost none of this. Sentiment stayed broadly positive throughout. What changed was the reason, and the reason is the actionable part. A brand still leading with antioxidant claims in 2026 is answering a question consumers stopped asking.
The supply side has not caught up either. ABC News reported the Nishio Tea Cooperative, which represents farmers and wholesalers in one of Japan’s largest matcha production areas, attributing the American boom to rising health consciousness among US consumers. The demand signal moved to ritual while producers kept describing a health story.
What are the best sentiment analysis tools for 2026?
The right choice depends on which data your decisions run on. Four of the five below read general text. One reads food.
1. Brandwatch
Enterprise sentiment analysis software for social listening and brand reputation across global markets. Strong coverage, mature alerting, and a good fit for communications and PR teams tracking share of voice.
2. Sprout Social
Social media management with sentiment analytics built in. Suits general customer service and community teams who want publishing, inbox and sentiment in one place rather than a specialist analysis layer.
3. Tastewise
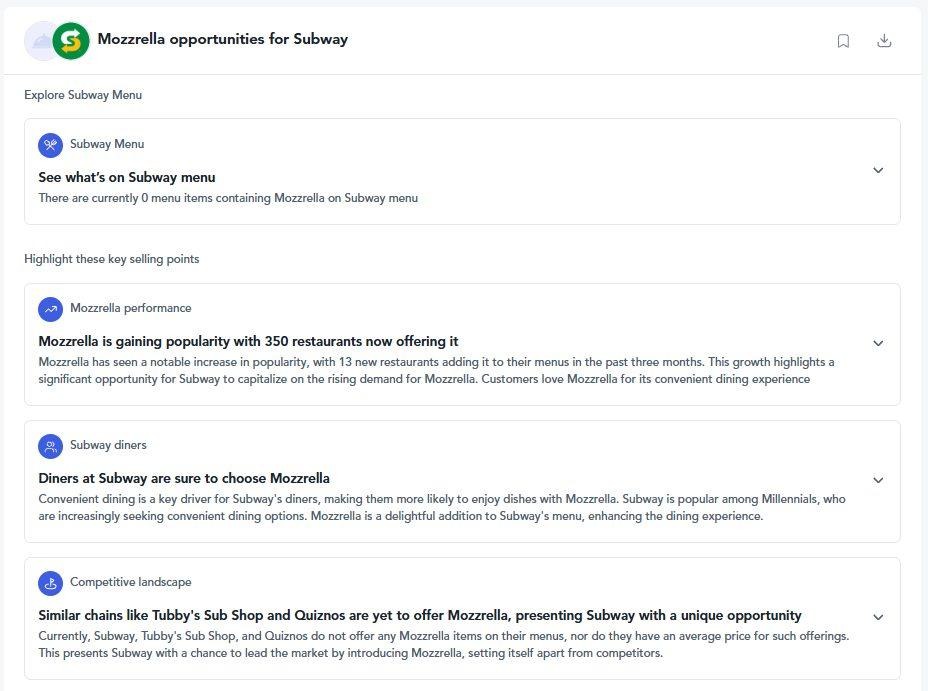
Built for food, beverage and CPG rather than adapted to them. Sentiment sits on top of menu tracking across 1,154,156 menu items and 152,585 restaurants. Recipe logs and retail shelf data feed the same view. That means a signal can be traced from conversation through to menu penetration and shelf presence, which is what turns a sentiment reading into a product decision. The trade-off is scope. It answers food questions, not questions about your SaaS support queue.
4. Medallia
Enterprise experience management with text analytics across surveys, contact center and social. Worth noting that Medallia absorbed MonkeyLearn, which older tool roundups still list as a standalone product. Medallia sells the capability inside its own platform today.
5. InMoment
Experience platform covering multi-language survey and unstructured text analysis. Lexalytics, another name that persists in outdated comparisons, now sits inside this product line.
For a wider view of food-native platforms and how they compare with general listening tools, the guide to best AI platforms for food trend analysis covers the category in more depth.
How can businesses effectively use sentiment analysis for data-driven engagement?
Translating emotion into product decisions
Attribute-level sentiment is where reformulation briefs come from. Track negative language against specific attributes such as sweetness, texture and packaging integrity. That gives your team a ranked list of what to fix. Broad brand sentiment gives you a number to report.
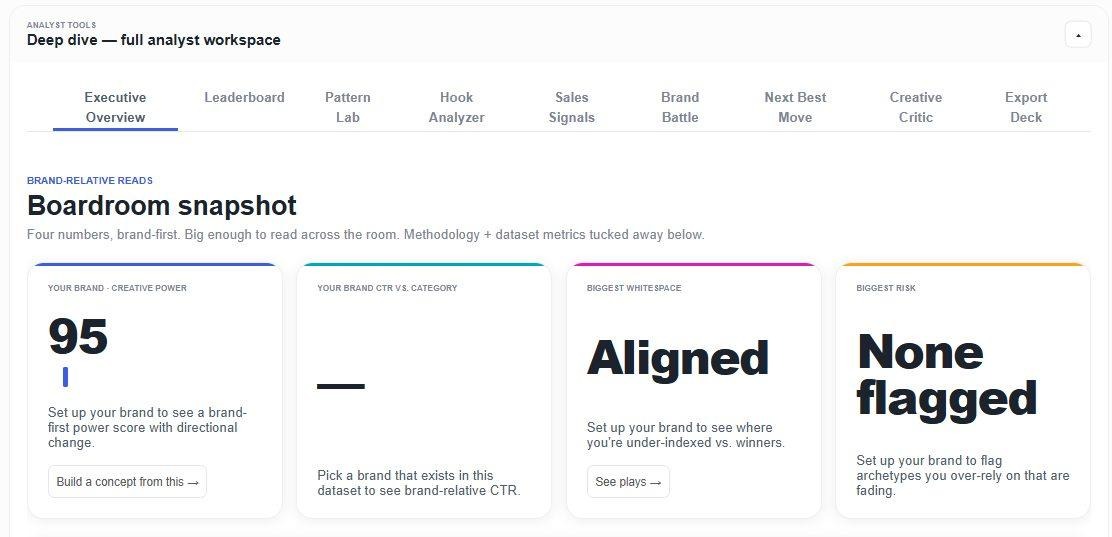
Attribute and chain-level output: menu presence, diner context and competitive whitespace.
The claims data above works the same way. Falling health language and rising ritual language points to a packaging and positioning change rather than a formula change. Teams running product innovation programs can test the reframing before committing to a reformulation, and the approach to AI-driven trend detection explains how lifecycle staging feeds that call.
Setting up early warning without false alarms
An automated sentiment analysis bot that alerts on any negative spike will train your team to ignore it. Useful alerting compares against a category baseline, so you learn whether a dip is yours or the whole segment’s.
One caution from this data set. Total post volume across matcha and green tea rose 26.7% over the year while nearly every individual ingredient’s share of conversation fell. Volume and share moved in opposite directions. A dashboard reporting raw counts would have shown growth everywhere. A dashboard reporting share would have shown decline everywhere. Read both, or you will act on the wrong one. Always-on monitoring through agentic AI workflows helps by keeping the comparison running rather than pulling it once.
Reading a real signal end to end
Take hojicha. Conversation growth of 24.4% would be easy to dismiss as noise at that volume. Menu penetration of 4.10% tells you operators have already started, so it is past the concept stage. Set that against green tea falling 36.2% and the pattern becomes clear. Interest is rotating within Japanese tea rather than leaving it.
That reading required three data types. Conversation growth alone would have been a guess. Foodservice teams tracking these shifts use similar cross-referencing, and foodservice data sources differ enough from retail that both are worth pulling.
Seven steps to implement sentiment analysis in your strategy
- Define the universe first. Decide which consumers, which category and which timeframe before you run a query. A sentiment score without a denominator cannot be compared to anything.
- Separate buzz from behavior. Post counts describe conversation volume. Menu penetration and purchase data describe behavior. Keep them in different columns.
- Set a category baseline. Score your brand against the category, not against last month, so you can tell a brand problem from a market movement.
- Break sentiment down by attribute. Track sweetness, texture, format and packaging separately, because a single brand score hides the thing you can fix.
- Track the reason alongside the polarity. Log which claims and motivations appear, so you catch a framing shift while sentiment still looks stable.
- Watch share and volume together. Confirm the direction on both before you escalate anything.
- Assign an owner per signal type. Route attribute complaints to R&D and framing shifts to marketing, or the analysis produces reports rather than changes.
Choosing between general and category-native tools
Run this test. Take a question your team actually needs answered this quarter. If it is “how do customers feel about our support,” a general platform handles it well. If it is “is the decline in green tea a problem for our matcha launch,” you need a tool that knows those are the same leaf.
Most teams end up running both. A listening platform for brand reputation, and a food-native platform for anything touching product, menu or shelf. The mistake is expecting one tool to answer both, then acting on an average that describes neither.
Frequently asked questions about sentiment analysis tools
For general brand and social monitoring, Brandwatch and Sprout Social are established choices, with Medallia and InMoment covering enterprise survey and contact center text. For food, beverage and CPG decisions, Tastewise is the option built on menu, recipe and retail data rather than adapted from general text analysis.
The right pick depends on your data source. A tool that scores 1,154,156 menu items answers different questions from one that scores support tickets.
Break it down by attribute and track the reason alongside the score. Brand-level polarity is a reporting metric. Attribute-level and claim-level analysis is what produces a change. The matcha and green tea data shows why, with health claims falling 45.1% and ritual language rising 67.7% while overall sentiment stayed positive.
Sentiment analysis is the automated classification of expressed emotion in text as positive, negative or neutral. It matters because feedback volume exceeds what any team can read, and direction of travel across thousands of comments is worth knowing early. Conversation volume in this data set rose 26.7% over the year, which is more than a human team can review.
Start by defining which consumers and category you are measuring, then set a category baseline so you can separate your movement from the market’s. Track claim language as a distinct signal from polarity. Framing shifts show up in claims first, as with slow living rising 86.5% while health language fell.
Speed, consistency and early detection. The specific benefit is catching a rotation before it reads as a decline, as with hojicha growing 24.4% and already appearing on 4.10% of menus while green tea fell 36.2%. Read as one category, that looks like collapse. Read properly, it is a rotation you can build a product against.



We’d love to learn your goals and see how Tastewise fits
We’d love to learn your goals and see how Tastewise fits
Get a personalized demo
Good taste. Wise move.
Your demo request is confirmed. We’ll reach out within one business day to schedule your walkthrough.
What happens next

See what’s driving demand, then turn it into a sell-in story for retailers and operators.
- Connect consumer panels, market trackers, and agents into one evidence view
- Get the “why” behind what’s changing, with explainable demand drivers
- Walk away with a buyer-ready narrative and next steps to activate
Trusted by





“Tastewise is my secret tool for knowing what consumers want next and why.“