





Seasonal planning used to run on a fixed calendar. Pumpkin in August, peppermint in November, citrus in spring. Seasonal food consumer insights for 2026 tell a different story, because your consumers have stopped following that script. The largest seasonal signal in the US is now shrinking while weather cues and weekend rituals climb.
Key takeaways
- Autumn is still the biggest seasonal signal in retail at 20.0% of the seasonal set, but it is down 8.6% on last year. Your fall lineup is indexing to a shrinking base.
- Weekend occasions are up 12.8% in the past year and lead summer choices for about 1 in 8 US summer consumers. In foodservice, the weekend is now a stronger planning unit than the season.
- Pumpkin spice sits at 4.86% of the seasonal set, down 24.5%, with menu presence at 0.7%. Its lifecycle stage reads declining, so retail should protect it and stop funding it as growth.
- Weather claims are outpacing calendar claims across social. Hot weather is up 22.2% and cold weather is up 11.5%, so your LTO trigger belongs on the forecast, not the launch calendar.
- Botanical tea flavors are the clearest ingredient gap. Strawberry hibiscus is up 312% and matcha is up 27.2% with menu presence at only 0.1%, which leaves foodservice room to move first.
- Flavor intensity is rising in both channels. Intense flavor is up 18.0%, depth is up 34.5% and sweet and spicy is up 38.4%, so seasonal no longer has to mean gentle.
Why seasonal food consumer insights are shifting in 2026
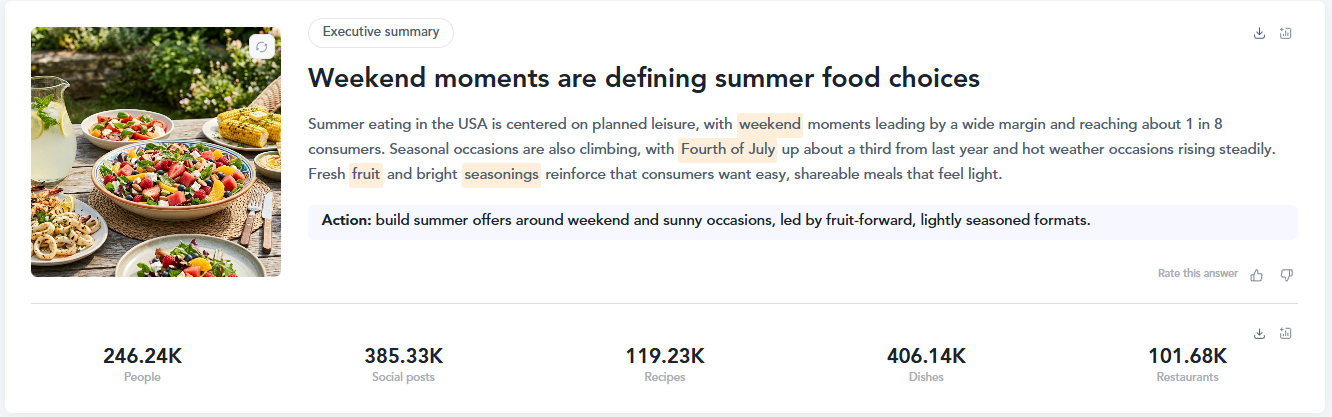
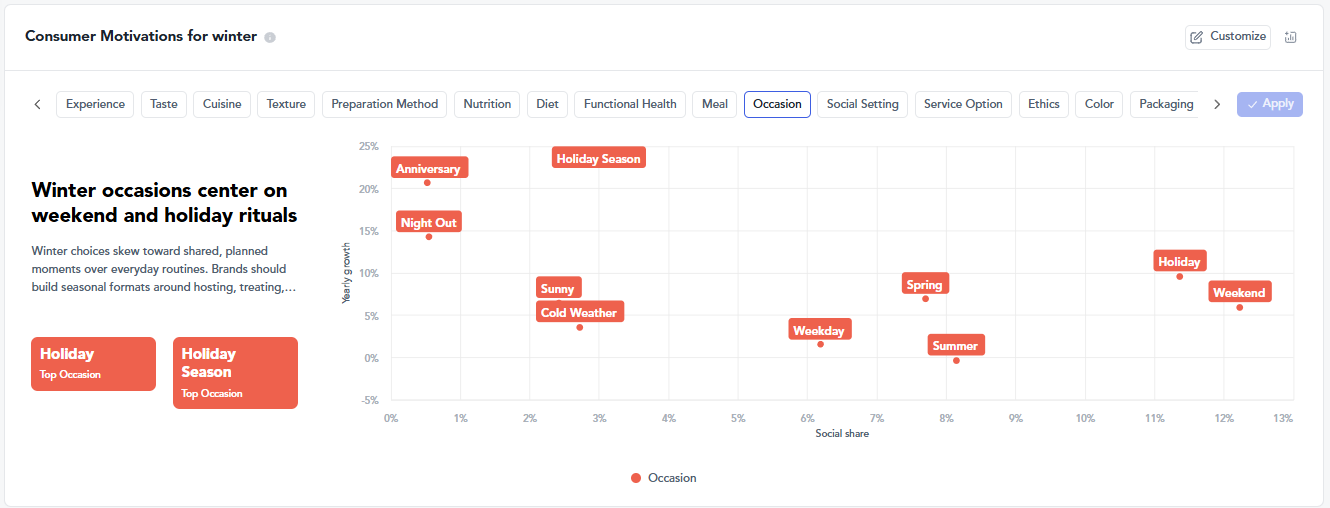
Seasonal eating in 2026 runs on the moment, not the month. Across the Tastewise US consumer panel, weekend moments lead summer food choices and reach about 1 in 8 US summer consumers. Fourth of July occasions are up about a third on last year and hot weather occasions are rising steadily. Your consumers are planning around leisure and forecast, not around your launch calendar.
The named signals split cleanly. Autumn remains the largest seasonal claim at 20.0% of the set, yet it has fallen 8.6% in the past 12 months. Weekend is up 12.8%, summer is up 10.0% and holiday is up 7.0%. Weather cues move fastest of all, with hot weather up 22.2% and cold weather up 11.5%.
Three drivers sit underneath that gap. Sensory depth is one, with intense flavor up 18.0% and depth up 34.5%. Digital aesthetics is the second, as home cooks recreate seasonal cafe formats faster than menus can carry them. Macro convenience is the third, with weekday seasonal eating up 14.4%. For R&D teams, a familiar seasonal base is now the cheapest way to de-risk a bold concept.
The quantitative pulse
| Largest seasonal signal | Autumn, at 20.0% of the US seasonal set, down 8.6% on last year |
| Fastest growing occasion | Weekend, up 12.8% in the past year |
| Menu presence | 406.14K seasonal dishes across 101.68K restaurants |
| Home and consumer layer | 246.24K people and 119.23K recipes in the seasonal set |
| Confidence | High. Four sources, US consumer panel, refreshed daily |
Source: Tastewise US consumer panel and operator data, July 2026. Figures describe demand signal and menu presence, not consumer penetration.
From signal to launch: seasonal insight in practice
The scenario below is illustrative. It is not a named customer outcome and the figures are directional.
An R&D innovation manager at a large snack brand needs to defend formulation and sourcing spend for a new seasonal line. Legacy research returns a category read six weeks later, by which point the buyer window has already closed.
In this scenario the team runs the seasonal set through Tastewise instead. They pair occasion growth with ingredient lifecycle staging, then confirm which seasonal pairings hold demand outside their peak weeks. Product innovation work moves from opinion to evidence in a single session.
The illustrative result: validation compresses from weeks to days, and the concept reaches the buyer meeting carrying a named occasion, a growth figure and a lifecycle stage. That is the difference between a seasonal hunch and a seasonal business case.
Consumer behavior signals across retail and dining out
Seasonal demand is not one behavior. It splits by channel, and the split is visible in the data. Autumn skews home, with 55% of its signal coming from the retail and home layer. Weekend skews the other way, at 56% restaurant. Night out, up 65.6% in the past year, sits at 52% restaurant. Your seasonal brief should therefore name a channel before it names a flavor.
Weather cues explain most of the movement. Cold weather is up 11.5%, hot weather is up 22.2% and snowy is up 31.7%, which means demand arrives with the forecast rather than the equinox. Social momentum then compounds it, because a warm week and a viral format land at the same time. Younger cohorts drive that compounding hardest, as the Gen Z eating habits data shows.
One finding cuts against the usual seasonal wellness narrative, and it is worth stating plainly. Inside the seasonal set, nutrition claims are receding. Protein is down 2.2%, vitamins are down 31.2%, antioxidants are down 29.0% and fiber is down 28.0%. Wellness still drives demand elsewhere, as the wider healthy food trends picture confirms, but it is not what is pulling seasonal demand right now. Taste and occasion are.
Where sustainability sits in seasonal food consumer insights
Sustainability does not appear as a named claim inside the US seasonal set. What appears instead is a cluster of sustainability-adjacent claims that are growing quickly. That distinction matters for how you write a seasonal pack, because it tells you which language currently has traction and which does not.
Clean-label claims inside the seasonal set
Real fruit is up 62.0% inside the seasonal set, no preservatives is up 33.6% and no artificial flavors is up 11.8%. Read those as claim velocity. They show which language is gaining ground across products, menus and social conversation. They do not measure why an individual shopper picked an item off shelf, and they are not penetration rates.
Seasonal eating as a sustainability association
Choosing food in season is widely linked in consumer conversation to local sourcing and natural growing cycles. The seasonal set on this page measures demand signal and menu presence, so it does not quantify that motivation. If your team wants to lean on it, treat it as positioning territory to test rather than a demand figure to cite.
Botanical flavors and plant-forward associations
Strawberry hibiscus is up 312%, peach hibiscus up 65% and matcha up 49% in the spring set. Tea-led profiles do carry plant-forward associations for consumers. Be careful about reading them as evidence of sustainability demand. The wider sustainable food trends picture shows plant-based declining as a sustainability claim while upcycled ingredients grow.
What the wellness decline does not show
Nutrition claims are receding inside the seasonal set. Protein is down 2.2%, vitamins down 31.2%, antioxidants down 29.0% and fiber down 28.0%. It is tempting to read that as consumers trading personal health for planetary health. The seasonal set does not support that read. Taste and occasion claims are carrying the growth instead, with intense flavor up 18.0% and depth up 34.5%.
The practical version for your 2026 seasonal lineup: if you want a sustainability angle on a seasonal SKU, build it from the clean-label language that is measurably moving rather than from a broad eco claim. Ingredient transparency and minimal processing are where the seasonal set gives you evidence. Broader eco-packaging and sourcing claims belong in your wider CPG sustainability plan, where the demand data actually sits.
What seasonal food consumer insights reveal about market opportunity
The gap sits between what consumers want and what is physically available. Matcha is up 27.2% in the seasonal set and carries a trending lifecycle stage, yet menu presence is 0.1%. Pumpkin spice is the mirror image, at 0.7% menu presence while demand falls 24.5%. Your category is over-supplied on the declining flavor and under-supplied on the rising one.
The risk of waiting is that the space is filling fast. Limited-time offer launches across chain restaurants were up 19% as of November, with close to 4,000 rolling out in that month alone. Every week you spend validating is a week a competitor spends on shelf. Projected market growth: [insert]. Unmet demand signal: [insert].
The packaging recommendation follows from the occasion data. Weekday seasonal eating is up 14.4%, which is not a multi-serve behavior. Move away from bulky multi-serve frameworks and toward on-the-go micro-convenience premiumization: sleek single-serve pouches, dual-compartment mix-in extensions and clean-label configurations built for active consumption. The claim data supports it, with real fruit up 62.0%, no preservatives up 33.6% and no artificial flavors up 11.8%.
Channel analysis: at home, out of home and social
At home
Home is where seasonal experimentation starts. The seasonal set carries 119.23K recipes, and the pattern inside them is recreation rather than invention. Home cooks rebuild cafe formats such as maple pecan lattes, spiked winter cranberry lemonade and ginger basil pumpkin soup. If your retail SKU cannot support that kind of remixing, it will lose to the version a consumer can build themselves.
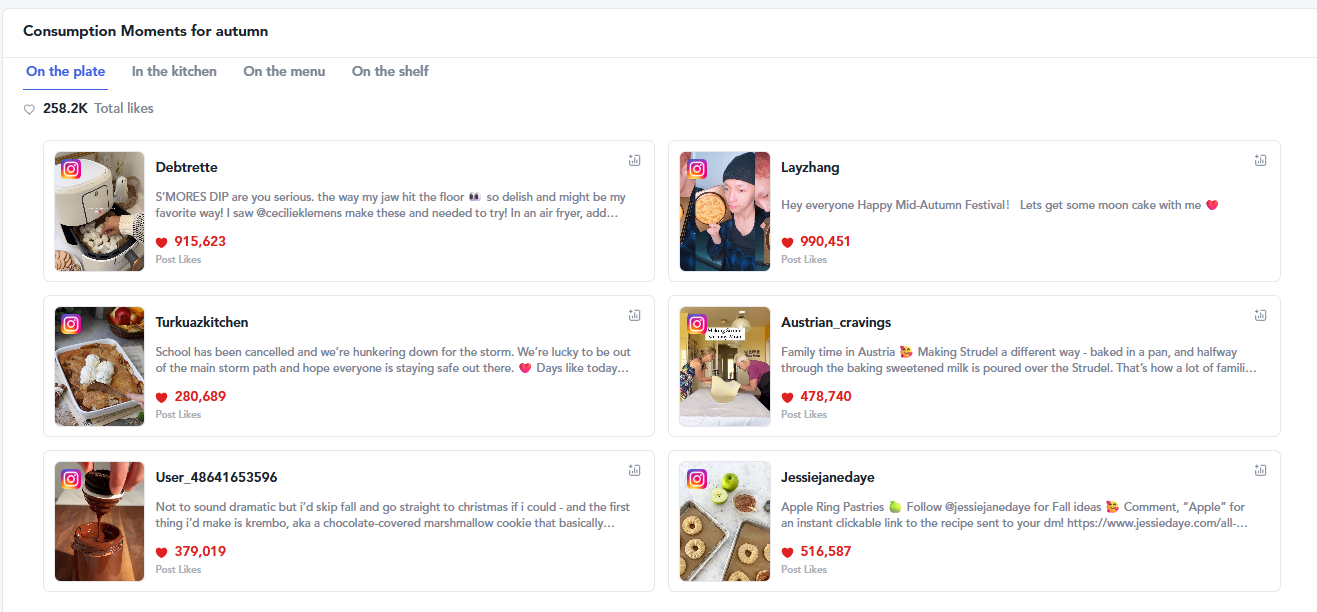
Social momentum sits on top of that home layer, and it is loud. Autumn plate moments alone carry 258.2K likes across the set. Treat that volume as a demand signal and a creative brief at the same time, because it tells your team which seasonal formats already have visual pull before you spend on production.
Away of home
Operators use seasonal accents to add complexity and drive traffic, and the scale is significant at 406.14K dishes across 101.68K restaurants. The imbalance is in what reaches the menu. Social share for botanical tea flavors is climbing while menu share stays near 0.1%, which is exactly the kind of gap menu planning teams can close inside one LTO cycle.
Limited service leads the innovation pace at 50% of LTO introductions against 44% for full service, with convenience stores at 6% of late-fall debuts. That makes QSR and fast casual your top growth channels for seasonal menu innovation. The foodservice forecast 2026 breaks the operator picture down by segment, and foodservice sell-in teams can carry the same evidence into an operator pitch.
Key seasonal ingredients to watch
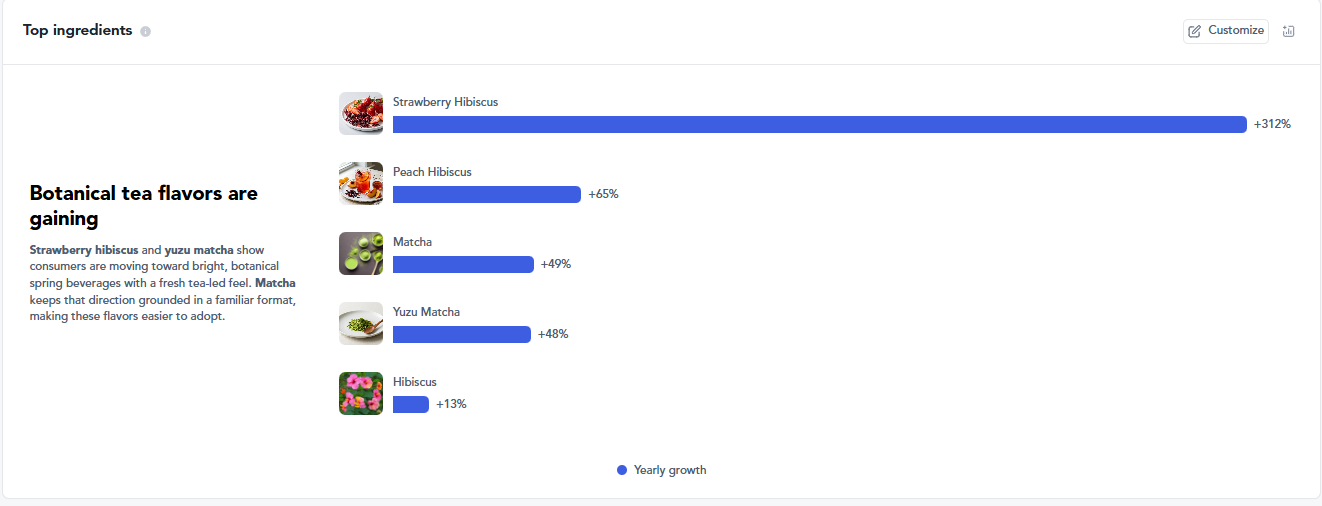
- Strawberry hibiscus, up 312%. Treat this figure as direction rather than scale, because the base is small. The read is early demand, not mainstream reach.
- Peach hibiscus, up 65%. The second botanical signal, which is what turns strawberry hibiscus from a spike into a direction.
- Matcha, up 49% in the spring set and 27.2% across the wider seasonal set. Trending lifecycle stage, familiar format, almost no menu presence.
- Yuzu matcha, up 48%. A citrus lift on a base your formulation team already knows how to handle.
- Hibiscus, up 13%. The parent ingredient is growing steadily, which supports the pairings above rather than competing with them.
- Pumpkin spice, down 24.5% with menu presence at 0.7%. Declining lifecycle stage. Protect the volume, retire the innovation budget.
The pattern is consistent. Bright, botanical, tea-led profiles are moving, and they sit on bases that are cheap to formulate against. That is the whitespace your 2026 seasonal lineup should be built on.
Strategic recommendations for R&D, marketing and sales
For R&D
Build the bold concept on the familiar base. Pair a tea-led format your plant already runs against a rising fruit note such as strawberry or peach hibiscus. You get novelty on the front of pack and a known process behind it, which is what makes a complex sensory profile survive a stage gate.
For marketing
Move your seasonal triggers off the calendar and onto weather and weekend cues. Hot weather is up 22.2% and cold weather up 11.5%, so a forecast-linked campaign flight will land closer to actual demand than a fixed August launch. Test claim language on taste and depth before wellness, because that is where seasonal momentum currently sits.
For sales
Lead the operator conversation with the menu gap, not the flavor. A signal growing 27.2% with 0.1% menu presence is a first-mover argument a buyer can act on. Pair it with the occasion split so the operator knows whether the item belongs on a weekend feature or a weekday value tier.
How teams act on seasonal demand signals
The scenarios below are illustrative. They are not case studies of named clients, and every outcome is directional. The R&D scenario earlier on this page covers concept validation, so these three cover the roles working around it.
Consumer marketing: moving the campaign flight
Challenge: A beverage marketing lead has a fall campaign locked to an August launch because that is when it ran last year.
Data input: Hot weather occasions up 22.2%, cold weather up 11.5% and weekend occasions up 12.8% in the past year.
Decision: Move the trigger off the calendar and onto the forecast, then hold a share of budget for the actual temperature swing rather than committing it all to a fixed date.
Outcome: Activation lands closer to the window where demand is present, and less spend runs through flat weeks. Consumer marketing teams get a flight plan they can defend with an occasion figure rather than a calendar habit.
Foodservice sales: building the operator pitch
Challenge: A foodservice sales manager needs a QSR operator to take a botanical LTO seriously when the flavor is unfamiliar to their menu.
Data input: Strawberry hibiscus up 312% with menu presence near 0.1%, plus weekend occasions drawing 56% of their signal from restaurants.
Decision: Lead the conversation with the menu gap rather than the flavor, and position the item as a weekend feature instead of a permanent listing.
Outcome: The operator has a first-mover argument attached to a named occasion, which is easier to act on than a taste opinion. Read the growth figure as early direction rather than scale, because the botanical base is small. The LTO calendar gives the pitch a timing frame.
Retail category management: splitting protect from fund
Challenge: A category manager has to hold shelf space for pumpkin spice while finding budget for something with upside.
Data input: Pumpkin spice sits at 4.86% of the seasonal set, down 24.5%, with menu presence at 0.7% and a declining lifecycle stage. Autumn draws 55% of its signal from the home and retail layer. Weekday seasonal eating is up 14.4%.
Decision: Keep pumpkin spice as a volume line and stop funding it as growth, then move innovation budget toward single-serve formats built for weekday consumption.
Outcome: Two separate arguments go to the buyer instead of one blended request. Retail sales conversations get a defensible reason for both the hold and the bet.
About this data
The insights on this page are powered by Tastewise AI, which analyzes billions of real-life consumer data points across social platforms, digital restaurant menus and online recipes to give a real-time view of seasonal food and beverage trends.
- Social and consumer panel: 385.33K social posts and 246.24K people in the seasonal set.
- Menu intelligence: 406.14K dishes tracked across 101.68K restaurants.
- Home and recipe layer: 119.23K recipes.
- Real-time updates: refreshed daily.
By blending consumer demand signals with live menu presence, we give your team a defensible read on which seasonal opportunities are real and which are already crowded. Share figures in this article describe demand signal and menu presence. They are not consumer penetration rates, and they should not be restated as a proportion of all consumers.
FAQs about seasonal food consumer insights
They are the demand signals that show how consumer food and beverage preferences shift across the year. In the current US set, autumn holds the largest share at 20.0% while weekend occasions grow fastest at 12.8%, which tells your team that the season and the occasion are moving in different directions.
Protect it, but stop treating it as growth. Pumpkin spice sits at 4.86% of the seasonal set, down 24.5% in the past 12 months, with menu presence at 0.7% and a declining lifecycle stage. It still delivers volume. It no longer delivers upside.
Botanical tea profiles lead. Strawberry hibiscus is up 312%, peach hibiscus up 65%, matcha up 49% in the spring set and yuzu matcha up 48%. Because the botanical bases are small, read those figures as early demand direction rather than mainstream reach.
Anchor the trigger to weather rather than the calendar. Hot weather occasions are up 22.2% and cold weather occasions up 11.5%, and demand arrives when conditions change rather than on a fixed launch date. A forecast-linked flight window keeps the item on menu while interest is peaking.
Consistently. Autumn draws 55% of its signal from the home and retail layer, while weekend occasions draw 56% from restaurants and night out sits at 52% restaurant. Your seasonal brief should name the channel first, because the same flavor plays a different role in each one.
Not inside the seasonal set. Protein is down 2.2%, vitamins down 31.2%, antioxidants down 29.0% and fiber down 28.0%. Taste and occasion claims are carrying seasonal growth instead, with intense flavor up 18.0% and depth up 34.5%.
The seasonal set does not measure that motivation directly. What it shows is that sustainability-adjacent claims are growing inside seasonal products, with real fruit up 62.0%, no preservatives up 33.6% and no artificial flavors up 11.8%. Those are claim velocity figures rather than stated consumer reasons. Treat them as language with traction and not as proof of eco-driven purchase.
Anchor the trigger to conditions rather than the calendar, then pick the item from the menu gap. Hot weather occasions are up 22.2% and weekend occasions up 12.8%, which sets the timing. Strawberry hibiscus up 312% against 0.1% menu presence sets the flavor. The occasion split then tells you whether the item belongs on a weekend feature or a weekday value tier.



We’d love to learn your goals and see how Tastewise fits
We’d love to learn your goals and see how Tastewise fits
Get a personalized demo
Good taste. Wise move.
Your demo request is confirmed. We’ll reach out within one business day to schedule your walkthrough.
What happens next

See what’s driving demand, then turn it into a sell-in story for retailers and operators.
- Connect consumer panels, market trackers, and agents into one evidence view
- Get the “why” behind what’s changing, with explainable demand drivers
- Walk away with a buyer-ready narrative and next steps to activate
Trusted by





“Tastewise is my secret tool for knowing what consumers want next and why.“