







Restaurant data collection is the process of gathering, structuring and analyzing what happens across restaurant locations, from menu items and pricing to guest sentiment and delivery channel performance. Done properly it tells you what changed, where it changed, and what to do next.
The problem is rarely a shortage of restaurant data. Order history sits in the POS, menus sit across three or four delivery marketplaces, and guest feedback sits on review sites. Nothing reconciles. A menu development lead cannot say whether a flavor is spreading or stalling. A foodservice sales team cannot say which operators are worth a pitch this quarter.
Fixing that means collecting at the location level, on a fixed cadence. Tastewise rebuilds its record of every restaurant and every dish each week across the US and UK, then layers the new week on top of the last. The comparison is where the answer sits. You can see which restaurants added or dropped an item, where prices moved, and which locations gained or lost a delivery partner. Openings and closures are tracked the same way.
That turns raw data for restaurants into something you can filter by category, location and audience. Operators use it to price and position a menu. Foodservice sales teams use it to build a target list of operators who already look ready for what they sell. The sections below cover how the collection works and which restaurant data to measure first.
Key takeaways
- Restaurant data collection is the practice of gathering, organizing and analyzing operational data, from sales figures and customer feedback to employee performance and menu results.
- Six returns justify the work. They run from faster decisions and trend detection through operational fixes and preference insight to KPI measurement and competitive tracking.
- Tastewise rebuilds its restaurant and dish records every week, documenting menu items and location data across four US delivery platforms and three in the UK.
- Data science connects one restaurant across multiple delivery platforms and clusters chain locations into a single record, so menu, pricing and social presence sit together.
- Layering each week on top of the last shows what actually changed: menu additions, price moves, new or ended delivery partnerships, plus openings and closures.
- A restaurant data warehouse centralizes POS logs, online order metrics, inventory counts and guest feedback. That single repository is what makes honest multi-unit reporting possible.
What is restaurant data collection?

Restaurant Data Collection refers to the process of gathering, organizing, and analyzing data related to restaurant operations. It includes both quantitative and qualitative data, such as sales figures, customer feedback, employee performance metrics, and more. The goal is to gain a comprehensive understanding of the business’s strengths and weaknesses and identify growth opportunities.
Benefits of restaurant data collection
Effective restaurant data collection is essential for any business to thrive in today’s competitive market. Here are some of the key reasons why:
Data-driven decision-making
Data-driven decision-making enables restaurant owners and managers to make informed decisions based on facts rather than assumptions or gut feelings.
Trend and pattern detection
By collecting and analyzing data, businesses can identify trends and patterns that can help them make strategic decisions. For example, if a particular menu item is consistently popular among customers, the restaurant can consider adding it as a permanent item.
Operational improvement
Data collection helps to identify areas for improvement in restaurant operations. For instance, by analyzing sales figures and customer feedback, businesses can identify which dishes are not selling well and make necessary changes to the menu.
Customer preference insight
Data collection can provide insights into customer preferences, such as preferred dining times, dietary restrictions, and favorite menu items. This information can help restaurants tailor their offerings to meet the demands of their target audience.
Measure success
By tracking key performance indicators (KPIs) such as revenue, profit margins, and customer retention rates, businesses can measure their success and make adjustments as needed to achieve growth.
Stay ahead of the competition
With data collection, restaurants can keep track of their competitors’ offerings, pricing, and promotions. This information can help them stay competitive and even gain a competitive advantage in the market.
How Tastewise collects restaurant data
At the beginning of each week, we start collecting data about every restaurant and every dish (or menu item) across our geographical data sets.
During this process, we document millions of dishes and aggregated data points about restaurant locations across multiple platforms – among them the four primary delivery platforms in the United States (Grubhub, Doordash, UberEats, and Postmates) and three delivery platforms in the United Kingdom (UberEats, Deliveroo, and JustEat).
After completing this process, we blend in social media data about the restaurant, so you can know not only what is happening on the menu itself, but also what are people saying about the restaurant location – all in real-time.
Connecting restaurant data across delivery platforms
In other words, how do we keep track of what happens across different platforms within a specific location, and “connect the dots”? If a restaurant works with two different delivery platforms, how do we connect between the two?
This is where Tastewise’s AI capabilities come in handy. Using data-science magic, we can tell every restaurant how many delivery platforms they work with, all of the social media data profiles available around the restaurant, and all of the contact details where you can reach out to the restaurant (including email, LinkedIn, phone number(s) and more).
Tracking restaurant data changes over time
Next, Tastewise uses aggregated data about restaurants in the all-in-one format to record changes in every restaurant every week. In this process (or in the dev lingo: “job”), the week’s data is put as a new layer on top of the previous week’s data, so we know what exactly changed in every location across the US and the UK.
Comparing the week’s data with the one before, Tastewise can tell you which restaurant added what items to its menu, what changes we’ve seen in pricing, and which restaurants started (or stopped) partnering with delivery platforms. Tastewise also tracks which restaurants open and close, so you can always tap into new business opportunities.
Where to start with restaurant data collection
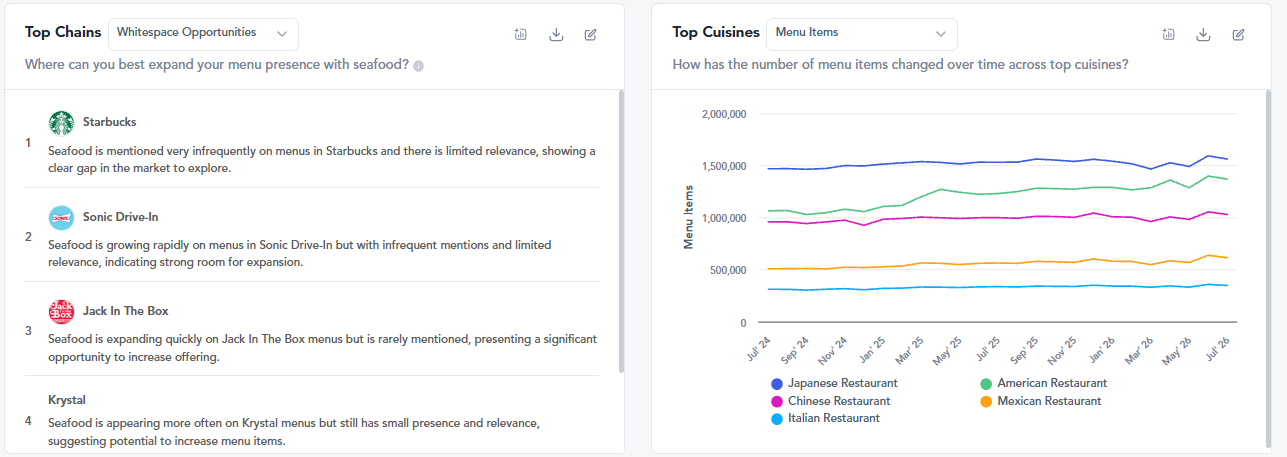
Not to worry – luckily, we got you covered! Using the Tastewise filters, you can adjust according to your category, location, audience, etc. and play around to make sure you get only what you need: a list of restaurants that will help you grow your business.
Targeting Italian restaurants that are single locations in Los Angeles? No problem. Looking for restaurants in Manchester that still don’t have delivery partners but do have an Instagram page? You got it. Need to reach out to high-end restaurants that started partnering with a delivery platform in the last two weeks? It’s all there.
Mix-and-match what’s best for you, and save the preset so you can come back and continue making data-driven decisions – all in the palm of your hand, in real time.
Centralizing operations with a restaurant data warehouse
Most restaurant groups already collect more data than they can read. Order history sits in the POS, guest sentiment sits in review platforms, stock counts sit in a separate inventory tool, and delivery performance sits with each marketplace. A restaurant data warehouse is a single repository that holds all of it under one schema, so a question about last week has one answer instead of four. The National Restaurant Association found that 60% of operators place themselves in the technology mainstream, while nearly 3 in 10 say they lag their peers.
Data aggregation and integration
Building a unified restaurant data warehouse starts with the feeds that change daily. Real-time POS logs from a system like Toast, Square or Oracle MICROS give you item-level sales and daypart splits. Online order metrics from DoorDash, Uber Eats and Grubhub give you channel mix and average basket size. Inventory tools such as MarketMan or Restaurant365 give you theoretical usage against actual usage. Loyalty records from Punchh or Paytronix attach repeat-visit history to the same guest ID.
Keys matter more than volume here. Once a location and a menu item carry the same identifier in the POS and on every delivery marketplace, you can report that item’s true contribution across channels. Platform integrations keep the warehouse current without manual weekly exports.
Strategic decision-making
Managing structured data restaurant channels in one place is what makes multi-unit comparison honest. When every location reports on the same schema, you can rank stores on prime cost, isolate the three units where food waste sits above target, and see which region is carrying a new LTO. Purchasing follows the same logic. Aggregated usage across 40 units gives you a real forecast to take into a supplier negotiation, rather than a per-store guess.
External signal belongs in the same repository. Restaurant and menu data from outside your own four walls shows which flavors are gaining menu presence in your category and which are drawing rising conversation volume. Read next to your own item-level performance, that becomes actionable data for restaurants: what to add, what to reprice, what to cut. Operators who work this way brief their foodservice sell-in and their restaurant marketing strategy from one evidence base.
Connect with a foodservice data expert at Tastewise
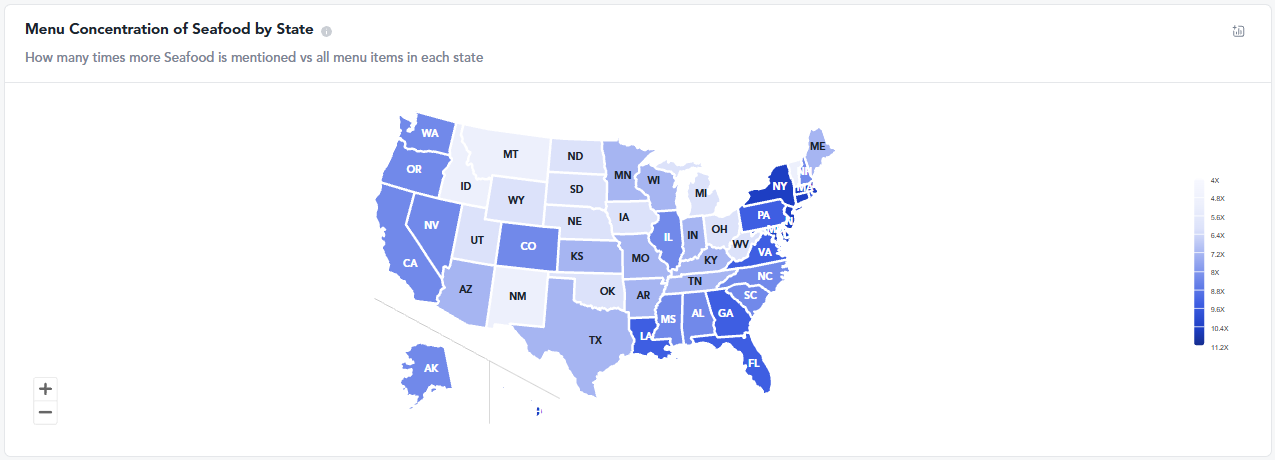
Contact us at Tastewise to learn more about how our data-driven solutions can help your restaurant business thrive.
From menu optimization to trend forecasting, we provide valuable insights and actionable recommendations based on real-time industry data.
Let us help you make informed decisions and stay ahead of the competition in the ever-changing foodservice landscape.
FAQs
It’s the process of gathering and analyzing customer, menu, and operational data. This helps restaurants make informed decisions that improve efficiency, experience, and profitability.
It identifies patterns in sales, diner behavior, and menu performance. This allows for better pricing, staffing, promotions, and menu optimization, driving both revenue and loyalty.
Top tools include POS systems, reservation platforms, sentiment analysis, and AI-powered platforms like Tastewise, which provide actionable insights from social and menu data.
Tastewise reads social conversation, menu listings and delivery data across its US and UK panels, then models that signal into real-time restaurant data insights. You can see which flavors and dietary claims are gaining menu presence in your category, filter by location and audience, and track how demand signal moves week to week. The live food trend tracker is the fastest way to check where a flavor sits today. Operators use it to time an LTO, price a new item, or pick the claim to lead with.
Prime cost, table turnover rate and food waste percentage are the three operational metrics to measure first. Add menu item profitability and guest retention to connect that operational picture to revenue. Prime cost, meaning combined food and labor as a share of sales, is the fastest read on whether a unit is viable. Measure all five on the same schedule so your restaurant data collection produces numbers you can compare month to month.


We’d love to learn your goals and see how Tastewise fits
We’d love to learn your goals and see how Tastewise fits
Get a personalized demo
Good taste. Wise move.
Your demo request is confirmed. We’ll reach out within one business day to schedule your walkthrough.
What happens next

See what’s driving demand, then turn it into a sell-in story for retailers and operators.
- Connect consumer panels, market trackers, and agents into one evidence view
- Get the “why” behind what’s changing, with explainable demand drivers
- Walk away with a buyer-ready narrative and next steps to activate
Trusted by





“Tastewise is my secret tool for knowing what consumers want next and why.“