
Business
Foodservice Data: Driving Strategic Growth in the Culinary Industry


Foodservice data is information about what customers in the foodservice industry buy and eat, and when and how they do it. Used well, it shapes your menu, staffing, purchasing and marketing decisions.
This guide explains what foodservice data is, how it is collected and how you can use it to understand customer preferences and make strategic decisions.
Key takeaways
- Foodservice data covers sales figures, menu items ordered, dining times and customer demographics, collected through POS systems, surveys and loyalty programs.
- You can use it to find your most profitable menu items, match staffing and inventory to peak dining hours and spot gaps in your menu or service.
- Data analytics applies across consumer behavior, inventory, cost control, marketing, operations and menu engineering.
- A foodservice data provider shows what your own systems can’t: what consumers want and what other operators are adding to their menus.
- Yuzu sits on 2.3% of US restaurant menus. Quick-service restaurants now account for nearly 1 in 10 US locations serving it (8%), more than triple their share a year ago.
- When you choose a provider, check that it connects consumer demand to menu data and shows the source behind every figure.
Understanding foodservice data
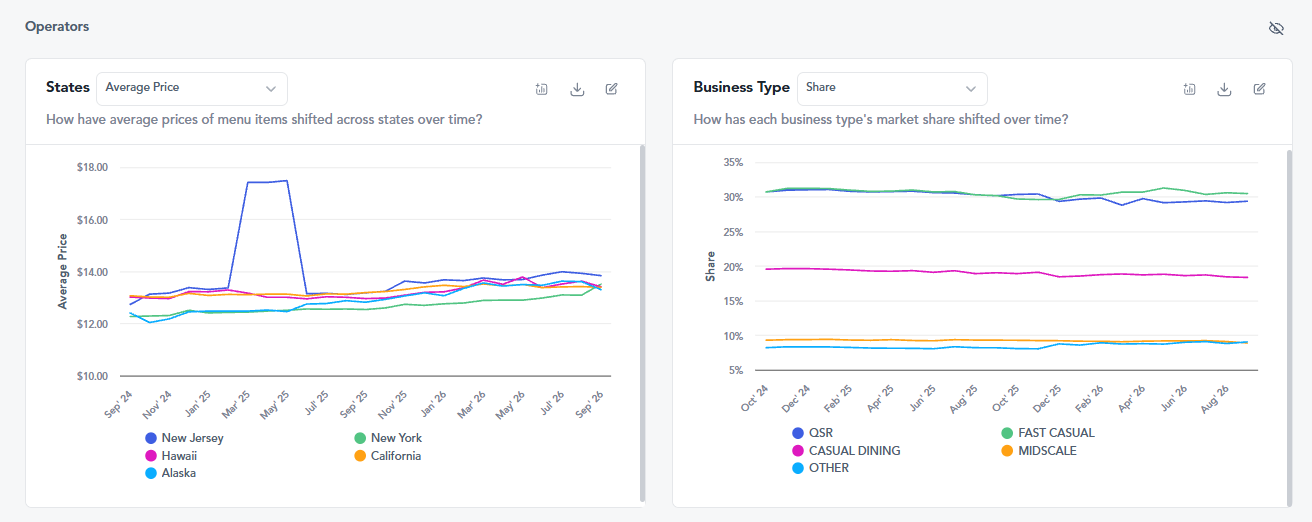
Foodservice data includes a wide range of information, such as sales figures, menu items ordered, time of day and day of the week when customers dine, and even customer demographics.
This data can be collected through various methods, including point-of-sale systems, surveys, and loyalty programs.
Foodservice insights can be obtained from this data, such as which menu items are the most popular, what time of day customers tend to dine, and whether there are any patterns in customer preferences based on demographics.
This type of information is invaluable for understanding your customer base and making informed decisions about your business.
Using foodservice data to make strategic decisions
One of the biggest advantages of foodservice data is its ability to help you make strategic decisions for your business.
For example, with sales figures and customer ordering habits, you can determine which menu items are the most profitable and focus on promoting those items.
With knowledge about when customers tend to dine, you can adjust your staffing and inventory levels accordingly.
Foodservice data also shows gaps in your menu or service that may be hurting customer satisfaction.
By analyzing customer feedback and preferences, you can make changes to your menu offerings or service process that will better cater to the needs of your customers.
The role of data analytics in the foodservice industry
Data analytics is the work of collecting, analyzing, and interpreting data so you can make better-informed decisions.
In the context of the foodservice industry, data analytics can help food businesses make data-driven decisions in the following areas:
Consumer behavior insights
Understanding customer buying behavior and consumer trends is essential for any food business. With data analytics, you can gain insights into customer preferences and behaviors such as ordering patterns, popular menu items, and peak dining hours.
This information can help you make informed decisions about menu offerings, staffing levels, and marketing strategies.
Inventory management
Food waste is a significant issue in the foodservice industry. By analyzing inventory data, you can identify which items are frequently wasted or underutilized and adjust your ordering accordingly to reduce waste and save costs.
Cost control
Foodservice data can also help you track and analyze your expenses, including food costs, labor costs, and overhead expenses.
This information can help you make better pricing decisions and identify areas where cost-saving measures can be implemented.
Marketing strategies
Data analytics can also aid in developing effective food marketing strategies. By analyzing customer data, you can target specific demographics with tailored promotions and advertisements. You can also track the success of your marketing efforts and make adjustments accordingly.
Operational efficiency
Using data to monitor and optimize operations, such as inventory management, kitchen processes, and staffing, can improve overall efficiency.
Menu engineering
Businesses can optimize their menus by thoroughly analyzing sales data and customer feedback. By understanding which items are most popular and profitable, they can make informed decisions to adjust their offerings.
This approach not only helps to maximize profits but also enhances overall customer satisfaction by ensuring their preferences are met.
Harnessing data for business growth
Foodservice businesses need to understand available data types and implement the right tools to collect, analyze, and interpret that data.
This includes using advanced analytics software. By doing so, they can gain insights into customer preferences, operational efficiency, and market trends, leading to better decisions and improved business performance.
Collect data from multiple sources
Businesses should gather data from various sources, including point-of-sale (POS) systems, online reviews, social media, and customer surveys, to gain a comprehensive understanding of their customers and the market landscape.
Track sales data and performance metrics
Using foodservice data to track foodservice sales progress and performance metrics can help businesses identify areas for improvement and make data-driven decisions to boost profits.
This includes monitoring popular menu items, identifying peak sales times, tracking average ticket prices, and analyzing customer feedback.
Monitor industry trends
Monitoring the latest foodservice trends helps businesses anticipate consumer demands and adapt their offerings.
Staying informed about popular ingredients, techniques, and dietary preferences allows companies to meet customer needs and stay competitive.
Regularly updating menus and incorporating trends attracts a broader audience and shows a commitment to quality and innovation.
Ongoing data analysis
Insights from data analysis should guide business strategies, helping foodservice establishments stay competitive.
By examining customer preferences, sales trends, and efficiency, businesses can make informed decisions to enhance service quality, streamline operations, and boost profitability.
This data-driven approach ensures establishments meet and exceed customer expectations in a changing industry.
Want to see what this looks like for your own menu or accounts?
Tastewise foodservice data insights
Tastewise is the proactive AI food and beverage intelligence system that delivers before you ask. It resolves consumer, menu and retail data into one dataset, reads it in the context of your category and accounts, and hands your team the finished work. For foodservice businesses, that looks like this:
Tailored insights
Tastewise collects and analyzes vast amounts of real-time data on consumer preferences, emerging trends, and market insights.
This data enables foodservice businesses to make informed decisions regarding product development, menu offerings, and marketing strategies.
Competitive benchmarking
Tastewise tracks competitor menu moves, so you can see which dishes, ingredients and price points rival operators have added that your menu lacks.
Menu optimization
Tastewise tracks the latest menu trends across US operators and shows which ones your customers care about, so you can decide what to add, rework or drop.
Personalized marketing
Tastewise shows which consumer groups engage with a dish or ingredient, so your marketing can speak to the people most likely to order it.
Choosing the right foodservice data provider for your business
Your POS data tells you what sold last week in your own locations. It can’t show you what consumers are starting to want or what other operators are adding to their menus. A foodservice data provider fills that gap. For commercial kitchens and the suppliers who sell to them, menus move quickly enough that a quarterly report lands late. You need market intelligence that refreshes often and breaks down by dish, ingredient and operator segment.
The right foodservice data provider links consumer demand to what reaches menus. Take yuzu. Across Tastewise US operator data, yuzu sits on 2.3% of restaurant menus, a share up nearly 10% on last year. The bigger change is where it appears. Quick-service restaurants now account for nearly 1 in 10 US locations serving yuzu (8%), more than triple their share a year ago, while fast casual’s share fell.
If you supply citrus ingredients or develop sauces and drinks for QSR chains, that points to where your next sell-in conversation should happen. If you run a casual dining menu, it tells you the flavor has reached the value tier, which may change how you price or present it.
When you compare providers, check how far ahead the data lets you see. Forecasts built on consumer and menu data together help you decide which ingredients to test before competitors add them and which recipes to rework. Check that every figure carries its source, so your culinary and sales teams can defend a decision in front of an operator or a buyer. And check that the data covers the segments you sell into, from QSR to fine dining, so the numbers reflect your own market.
Foodservice data use cases in practice
The four scenarios below are illustrative. They describe situations foodservice teams commonly face, and none of them is a case study of a named client. Each one follows the same path: the problem, the foodservice data used, the decision and what changed.
A regional chain cuts waste on slow-moving dishes
A regional chain keeps throwing out the same perishable produce at the end of each week. Its ordering follows last season’s volumes, and nobody can see which menu items are driving the waste.
The team lines up item-level POS sales by location and daypart against inventory and waste logs. Two dishes turn out to sell well below what the kitchen preps for. Market data adds the outside view: whether consumer demand for those dishes is fading across the market or only at the chain’s own locations.
Where demand is fading everywhere, the chain retires the dish. Where the problem is local, it cuts prep volumes and moves the item to the dayparts where it sells. Ordering now tracks current sales, so less produce ends the week in the bin.
A CPG supplier finds its next channel in QSR
A supplier of a yuzu sauce base has pointed its sales team at fast casual chains, and the pitch has started to stall.
Operator segment data shows why. As covered above, quick-service restaurants’ share of US locations serving yuzu has more than tripled in a year, while fast casual’s share fell. The ingredient is moving into the value tier.
The supplier shifts its account list toward QSR chains and builds each pitch around that segment shift, with the source behind every figure. Reps walk into QSR meetings with evidence a buyer can check, which is the core of how CPG brands grow in foodservice.
A fast casual operator closes a menu gap against competitors
A fast casual chain sees traffic flatten at locations near two competitors. Its menu team can’t say what those rivals offer that its own menu lacks.
Competitive benchmarking on operator menu data lists the dishes, ingredients and price points both competitors added in the past year. Consumer data then shows which of those ingredients the chain’s own customers already engage with.
The team picks one gap with both competitor presence and consumer demand behind it, and tests it as a limited-time offer in a handful of locations. The decision rests on evidence the culinary and finance teams can both review, and the test results show whether the item earns a permanent place.
A distributor times a new SKU with trend forecasting
A foodservice distributor wants to add a specialty ingredient. Stock it too early and cash sits in the warehouse. Stock it too late and operators have already found another source.
AI-powered trend prediction reads consumer demand and menu movement together. When consumers keep engaging with an ingredient month after month while it still appears on few menus, the gap between those two signals is the early warning.
The distributor tracks the ingredient’s menu presence by operator segment and brings in the SKU as it spreads from early adopters into wider segments, timed to its customers’ menu planning cycles. Its reps arrive with the data that explains why the item belongs on the order sheet.
Conclusion

Foodservice data shows you what customers order, when they order it and what the wider market is adding to menus. The earlier you see a shift, the more time you have to act on it.
Tastewise adds the market view: consumer demand and competitor menu moves, with the source behind every figure.
Use it to decide which dishes to add, rework or retire, and to back those calls with evidence your team and your buyers can check.
Ready to see what Tastewise flags for your menus?
FAQs about foodservice data
Restaurants collect sales data, ingredient costs, customer ordering patterns, loyalty metrics, reservation trends, and reviews. More advanced systems gather sentiment analysis from online feedback, dwell time in stores, and even weather-related ordering behavior. Together, these data points help inform operations, marketing, and menu strategy.
Data helps identify top-selling items, high-margin dishes, and underperforming SKUs. This allows for smarter decisions on which items to promote, update, or remove. Trends in customer preferences can also guide new product development or limited-time offers, ensuring menus stay relevant while maximizing profitability.
POS data, seasonality patterns, historical trends, consumer preference data, and local events are all inputs worth tracking.
These data types help operators anticipate shifts in demand and prepare accordingly. Real-time demand forecasting also assists with labor planning, ingredient sourcing, and reducing food waste.
Understanding what, when, and how customers order provides clarity on their priorities and habits. Behavior data can highlight preferences for health-forward options, meal customization, or combo deals. With these insights, restaurants can create targeted promotions and personalized experiences that increase order size and frequency.
Tastewise tracks foodservice data from more than 4 million operator locations alongside consumer data, so you can see which dishes and ingredients are gaining menu share, which operators carry them and which consumers want them. AI agents watch your categories, accounts and competitors and send your team the finished work, such as a menu gap analysis or an operator-ready pitch, before you ask. Every figure carries its source.
POS data records what sold in your own locations: items, tickets, times and prices. Foodservice market data covers the wider market, meaning what consumers want and what other operators add to or drop from their menus. POS data shows how your menu performed last week. Market data shows where demand is heading before it reaches your sales figures, which is why most teams use the two together.
It depends on the source. POS systems update with every transaction, while syndicated industry reports often arrive quarterly. Menus change quickly enough that a quarterly read can land after a shift has already reached your competitors. For menu and trend decisions, look for market data that refreshes continuously and shows the date and source behind each figure.
Suppliers use operator menu data to find accounts where their ingredient or category fits but isn’t on the menu yet. Segment data shows which operator types are adding it, and consumer data shows the people behind that demand. Together they give a sales rep a pitch built on the operator’s own segment and customers. Yuzu is a good example: QSR’s share of US locations serving it has more than tripled in a year, which points a citrus supplier toward QSR buyers.
AI-powered trend prediction reads consumer demand and menu data continuously and flags which dishes, ingredients and flavors are likely to grow on menus. It looks for movement that holds over time and across more than one source, so a one-week spike doesn’t register as a trend. For foodservice teams, the output is a shortlist of what to test, pitch or stock before competitors move. Our guide to food trend prediction covers the methods in more depth.
QSR chains run standardized menus across many locations, so they use foodservice data to decide what can scale. That means checking whether an ingredient has moved beyond premium and fast casual menus, and whether consumer demand will hold at a value price point. Fine dining and chef-led independents often read the same data earlier in a trend’s life, to spot ingredients while they are still emerging. Yuzu shows the handoff, with QSR’s share of US locations serving it more than tripling in a year.
Start with your own sales metrics: units sold and margin per item, average ticket and peak sales times. Add customer feedback to explain why an item over- or underperforms. Then add market metrics: how many menus carry the dish or ingredient, how that share has changed in the past year and which operator segments are adding it. The first set tells you how an item performs on your menu, and the second tells you whether the demand behind it is growing or fading.
Cite this article
Daniels, L. (2024). Foodservice Data: Driving Strategic Growth in the Culinary Industry. Tastewise. https://tastewise.io/blog/foodservice-data. Updated 12 Nov 2026


