





If you are formulating a plant protein product this year, the pea protein vs soy protein decision is a demand call before it is a nutrition call. Across the Tastewise US consumer panel, both proteins are being pulled out of the workout aisle and into everyday wellness, but they are being pulled in different directions. Pea protein is attaching itself to fiber and digestive benefits. Soy protein is anchoring to clean vegan positioning and sugar reduction.
That split matters more than the amino acid table, because it decides which claim you lead with and which buyer you can sell to. Most comparisons of soy protein isolate vs pea protein stop at grams per scoop. This one looks at what US consumers are actually reaching for, what operators are actually putting on menus, and where the two proteins are winning different rooms.
Key overview of pea protein vs soy protein
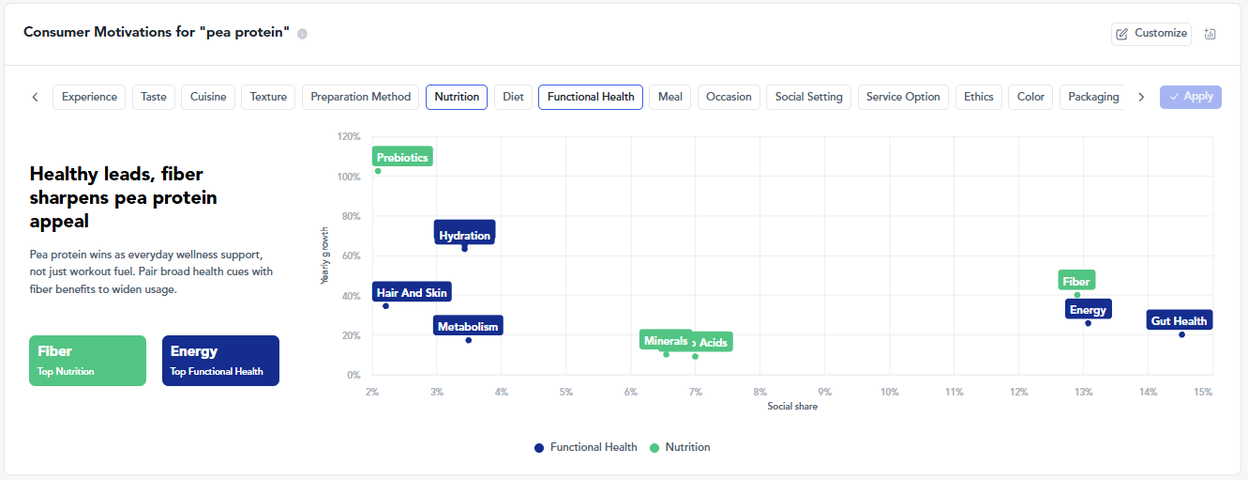
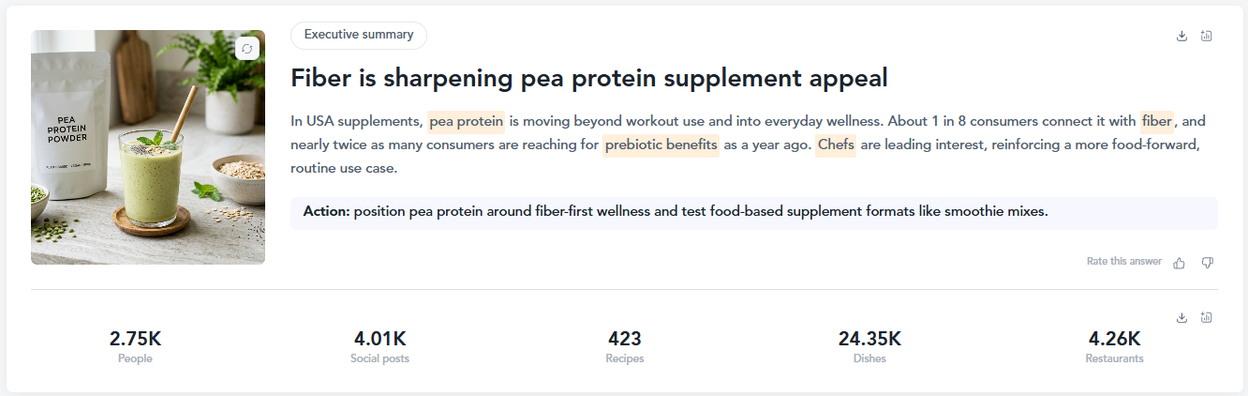
- Pea protein reaches more everyday wellness usage. About 1 in 8 US pea protein supplement consumers now connect it with fiber, and prebiotic interest has nearly doubled compared with last year.
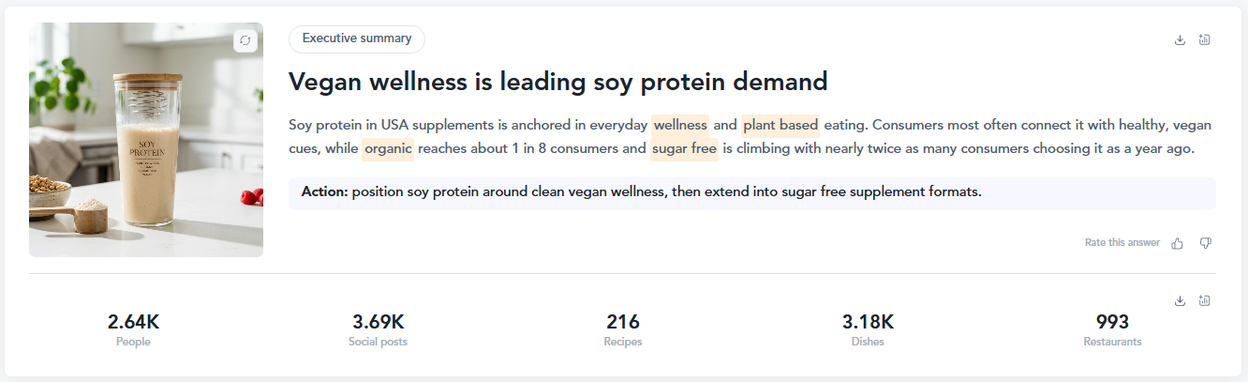
- Soy protein is holding the clean vegan position. Organic reaches about 1 in 8 US soy protein supplement consumers, and sugar free interest has nearly doubled in the same window.
- Allergen anxiety is measurably attached to soy. The soy free claim carries about 3 in 10 of soy protein demand signals in the US supplement category, against nearly 1 in 20 (5.3%) on the pea protein side.
- Operators are executing on pea faster. Pea protein appears across roughly four times more US restaurant locations than soy protein in this category, and pea dish counts have grown 71.7% in the past year.
- Taste remains the real formulation risk. Chalky descriptors on pea protein are up 64.8% and aftertaste descriptors are up 52.7%, so masking work decides repeat purchase.
Those five signals should shape the claim hierarchy on your pack before you settle the protein source. For the wider set of Q3 shifts these signals sit inside, including the high-protein and satiety moves reshaping the category, see the Q3 2026 food trends report.
What is the difference between pea protein and soy protein?
Soy protein is a complete protein derived from soybeans, and soy is one of the major labeled allergens in the US. Pea protein is extracted from yellow split peas, sits outside the major allergen list, and delivers a different amino acid balance with more lysine and leucine and less methionine.
Both arrive in isolate and concentrate forms. Isolates run around 90% protein by weight, concentrates closer to 70%, which is why most supplement formats reach for the isolate. The functional gap shows up in solubility, mouthfeel and cost rather than in raw protein content.
Nutritional profile and amino acid comparison
When you compare soy protein isolate vs pea protein on measured protein quality, soy scores higher. A peer-reviewed review of digestible indispensable amino acid scores across seventeen protein sources classified soy as a high-quality protein and placed pea in the lower band. The limiting factor is methionine, according to research published in Food Science and Nutrition.
That gap narrows fast in practice. Pea protein carries more leucine per serving, and leucine is the amino acid doing most of the muscle protein synthesis work. Blending pea with rice or oat protein closes the methionine gap, which is why rice appears as a formulation partner across a fifth of pea protein demand signals in this category.
The demand data tells you how much consumers care. The complete protein claim carries roughly 1.5 times more share on soy protein than on pea protein, which reflects soy’s longer run in the vegan aisle. Pea is closing that distance, with the complete protein claim up 12.5% on pea against roughly flat movement on soy. Consumers are learning that pea qualifies, and that shifts what you are allowed to say on pack.
Iron content and bioavailability
For anyone searching pea protein vs soy milk which has higher iron, the honest answer depends on the format rather than the crop. Pea protein isolate typically carries meaningful iron because iron concentrates alongside the protein during extraction. Commercial soy milk is often fortified instead, so a fortified soy milk can outperform an unfortified pea beverage on the label while the underlying crops sit closer together.
Processing decides the outcome. Wet fractionation strips phytates that inhibit iron absorption, so two pea isolates from different suppliers can behave differently in the same formula. The bioavailable claim is up 50.8% on pea protein demand signals, which suggests consumers have started asking about absorption rather than the number on the panel.
The interesting movement is on the soy side. Iron interest is rising 23.1% on soy protein while softening 11.3% on pea, which runs against the assumption that pea owns the iron story. If you are building an iron claim, soy is the growing conversation and pea is the established one. That inversion is the kind of thing a static category report will not show you, and it is covered in more depth across our health and nutrition trends analysis.
How Tastewise uses data-driven insights to predict plant protein trends
Tastewise reads live demand across social signals, home cooking recipes, retail shelves and restaurant menus, then models it into a consumer view of the US market. That means you see a claim moving while it is still cheap to act on, rather than reading about it two quarters after your formulation gate closed.
The pea protein picture in US supplements shows a protein escaping its original use case. Everyday positioning is up 19.5% and convenience is up 17.2%, while fitness positioning is falling. Chefs are leading interest in pea protein, which points at food-forward formats rather than tubs. The action that follows is specific. Position pea around fiber-first wellness and test food-based formats such as smoothie mixes and oat bowls.
Soy protein is running a different play. It is anchored in everyday wellness and plant based eating, with consumers connecting it most often to healthy and vegan cues. Organic reaches about 1 in 8 of those consumers and sugar free is climbing sharply. The action there is to hold the clean vegan position and extend into sugar free formats rather than chasing the fiber story pea has already claimed.
Allergen consciousness against taste
The allergen signal is the clearest commercial separation between the two. Within soy protein demand in this category, the soy free claim sits at about 3 in 10, so a meaningful share of the people engaging with soy protein are simultaneously signaling that they want to avoid it. On pea protein the same claim sits at nearly 1 in 20 (5.3%). Non-GMO interest is also softening 13.5% on soy while holding steadier on pea.
Operators have already priced this in. Lady and The Shallot sells a breakfast bagel sandwich built on a soy free pea protein patty, with the allergen status written directly into the menu description. That is what allergen positioning looks like once it stops being a pack claim and becomes a reason to order.
The counterweight is sensory. Chalky descriptors on pea protein are up 64.8%, earthy descriptors are up 33.7%, and aftertaste mentions are up 52.7%. Soy carries its own beany profile but is not accumulating texture complaints at the same rate. Pea wins the allergen argument and then has to survive the second sip.
Flavor profiling and masking
Masking is where the pairing data earns its keep. Cocoa, vanilla and nut butter carry the heaviest share of pea protein formulations, which is the familiar chocolate and peanut butter cover. The growth is elsewhere. Edamame pairings are up 43.1%, split pea is up 51.2%, chickpea is up 12.2% and mushroom is up 24.8%, which points toward savory and legume-forward execution rather than another dessert flavor.
Menus show the same pattern. Tropical Smoothie Cafe runs a chocolate peanut butter protein smoothie, Nekter Juice Bar sells crunchy peanut protein poppers, and Crisp & Green lists a maple pea nut smoothie. Pressed carries the Mezcla matcha protein bar. These are food formats with flavor systems already built, which is why they absorb pea protein without a masking crisis.
Ready to see which claims are moving in your category? Request a demo of the platform today.
Real-world success: driving plant-based growth through AI analytics
CPG brands and foodservice operators use Tastewise to validate an alternative protein choice before the formulation spend lands, to pick the claim that will carry the pack, and to walk into a retail buyer meeting with a demand signal instead of a category average.
Work through the decision the way a manufacturer would. A US supplement brand is building a plant protein line and has to choose between soy protein isolate and pea protein. The nutrition team prefers soy on protein quality scores. The demand data complicates that preference in three useful ways.
First, reach and execution. Pea protein appears across roughly four times more US restaurant locations than soy protein in this category, and pea dish counts have grown 71.7% over the last twelve months against 66.7% for soy. Both are being executed on, but pea has the wider operator footprint to point at in a buyer conversation.
Second, claim availability. Soy arrives with the soy free claim attached to about 3 in 10 of its own demand, which limits how far a clean label story can travel. Pea arrives with fiber and prebiotic momentum and almost no allergen drag, which gives the pack a claim nobody is arguing with.
Third, the risk that actually kills the launch. Pea’s rising chalky and aftertaste descriptors say the product fails on repeat purchase rather than on trial. That reframes the R&D brief. The spend goes into texture and masking work, not into protein quality, and the launch gate moves to a sensory panel rather than a nutrition panel.
The commercial answer for this brand is pea protein with a fiber-led claim, a food-adjacent format, and a masking budget defended up front. Soy stays in the portfolio for the sugar free vegan line where its own signals are strongest. Teams running this kind of comparison at speed usually work through product innovation workflows, with AI agents handling the repeat pulls as the category moves.
Whitespace data closes the loop. Starbucks, Pizza Hut and Auntie Anne’s all show unmet pea protein demand in the US operator set, which is where a supplier pitch has room to land. The same logic applies across the category, and the pattern is consistent with the shift away from identity-led positioning documented in our novel protein trends work.
What pea protein vs soy protein means for your next launch
Treat this as two different commercial positions rather than one winner. Pea protein carries the everyday fiber and gut health story, the allergen advantage, and the wider menu footprint, and it costs you sensory work. Soy protein carries measured protein quality, the clean vegan position, and rising organic and sugar free interest, and it costs you the allergen conversation.
Pick the protein that fits the claim you can defend, then budget for the weakness that comes attached. Consumer preference on plant protein keeps moving toward familiar formats and recognizable ingredients, a pattern that also runs through plant-based food trends and the wider US food trends picture.
Frequently asked questions about pea protein vs soy protein
Soy protein scores higher on measured protein quality, while pea protein carries the allergen advantage and stronger everyday wellness momentum. Pea protein appears across roughly four times more US restaurant locations than soy protein in the supplement category, so operator execution currently favors pea.
Choose on the claim you need rather than the nutrition panel alone. A fiber or gut health position points to pea. A clean vegan or sugar free position points to soy.
Pea protein contains all nine essential amino acids but is limited in methionine, which is why it scores lower than soy on digestible indispensable amino acid scoring. The complete protein claim is growing 12.5% on pea protein demand in US supplements, against roughly flat movement on soy.
Blending pea with rice or oat protein closes the methionine gap and supports a complete protein claim on pack.
Pea protein isolate usually carries meaningful iron from the extraction process, while commercial soy milk is often fortified instead, so a fortified soy milk can show a higher figure on the label. Iron interest is currently rising 23.1% on soy protein and softening 11.3% on pea protein.
Absorption matters more than the label number, and bioavailable interest on pea protein is up 50.8% as consumers start asking about it.
Soy protein isolate is extracted from soybeans, runs around 90% protein by weight, and is a labeled major allergen in the US. Pea protein comes from yellow split peas, sits outside the major allergen list, and carries more leucine and lysine with less methionine.
The soy free claim sits at about 3 in 10 of soy protein demand in US supplements, which is the practical difference for a clean label pack.
Pea protein carries earthy notes from the legume base, and chalky descriptors on pea protein are up 64.8% with aftertaste mentions up 52.7%. Soy protein carries a beany profile but is not accumulating texture complaints at the same rate.
Cocoa, vanilla and nut butter remain the heaviest masking systems on pea, while edamame and legume-forward pairings are growing 43.1% and 51.2% respectively.
Both are moving out of fitness and into everyday wellness, in different lanes. About 1 in 8 US pea protein supplement consumers connect it with fiber, and prebiotic interest has nearly doubled compared with last year. On the soy side, organic reaches about 1 in 8 US soy protein supplement consumers and sugar free interest has nearly doubled.
Pea protein dish counts on US menus have grown 71.7% in the past year, against 66.7% for soy protein.




We’d love to learn your goals and see how Tastewise fits
We’d love to learn your goals and see how Tastewise fits
Get a personalized demo
Good taste. Wise move.
Your demo request is confirmed. We’ll reach out within one business day to schedule your walkthrough.
What happens next

See what’s driving demand, then turn it into a sell-in story for retailers and operators.
- Connect consumer panels, market trackers, and agents into one evidence view
- Get the “why” behind what’s changing, with explainable demand drivers
- Walk away with a buyer-ready narrative and next steps to activate
Trusted by





“Tastewise is my secret tool for knowing what consumers want next and why.“