





Energy drink vs coffee is a bigger question for US beverage teams in 2026 than a caffeine count. Across the Tastewise US consumer panel, coffee holds about 8x the consumer interest that energy drinks hold. Yet energy drinks are gaining menu presence faster than coffee, at 4.3% growth against 3.2% over the past year. Consumers are also changing what they want from a caffeinated drink, with sugar and wellness cues losing ground to flavor and convenience. This guide compares caffeine, health effects and formulas, then shows where US demand is heading.
Consumer interest share is the portion of US consumer interest in beverages that a drink or ingredient holds across the Tastewise US consumer panel. Every growth figure below compares the past 12 months with the 12 months before.
Key takeaways
- A 16 oz can of original Monster Energy carries 160 mg of caffeine, about the same as two 8 oz cups of brewed coffee at 80 to 100 mg each.
- Coffee holds about 8x the US consumer interest of energy drinks, and both dipped over the past year: energy drinks by 6.1% and coffee by 1.4%.
- Within energy drinks, the healthy consumer need fell 38% while celebration rose 33%, which moves the category toward social occasions.
- Sugar is losing ground in energy drinks, down 14%, and lion’s mane fell 17%, while NAD+ is trending up 38%.
- Cold brew menu items grew 27% in a year, and the average cold brew item now costs $6.00, up 7.5%.
- Energy drink interest is moving into convenience stores, up 151% among Circle K shoppers and 137% among Speedway shoppers.
What is the difference between energy drinks and coffee?
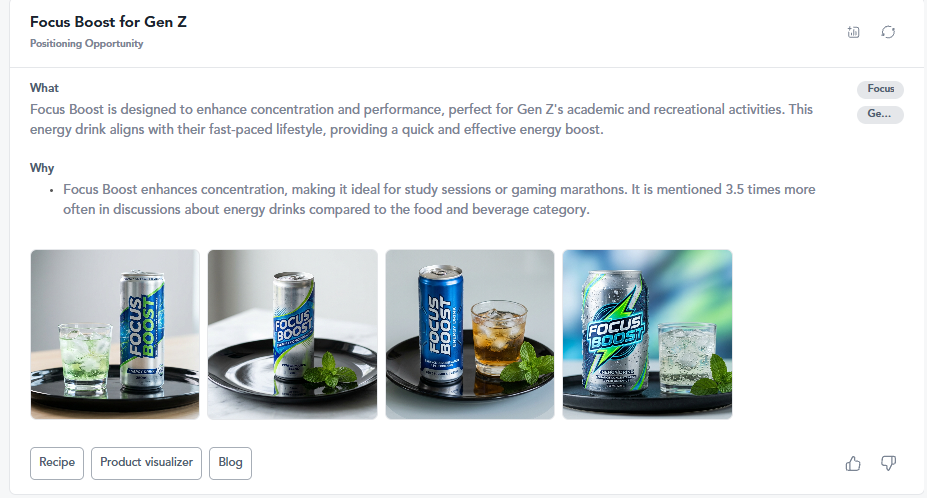
Energy drinks and coffee are both everyday dietary sources of caffeine, a central nervous system stimulant. Coffee gets its caffeine and antioxidants naturally from brewed coffee beans. Energy drinks use formulated caffeine, either synthetic or from plant extracts, combined with amino acids, B vitamins and other functional additives.
That split shapes every part of the energy drink vs coffee decision, from the dose in the cup to the reason a consumer reaches for it.
Caffeine content & dosage comparison
Any coffee vs energy drink caffeine comparison starts with serving size. The FDA’s caffeine guidance puts an 8 oz cup of brewed coffee at 80 to 100 mg of caffeine. The same 8 oz of energy drink can hold anywhere from 40 to 250 mg.
So how much caffeine in an energy drink vs coffee depends on the can and the cup. A 12 oz coffee lands around 120 to 150 mg. A 16 oz can is the standard energy drink size, and that changes the math. Here is how caffeine in a cup of coffee vs energy drink compares across common servings.
| Drink | Serving | Caffeine | Caffeine per fl oz |
| Brewed coffee | 8 oz cup | 80 to 100 mg | 10 to 12.5 mg |
| Brewed coffee | 16 oz cup | 160 to 200 mg | 10 to 12.5 mg |
| Monster Energy, original | 16 oz can | 160 mg | 10 mg |
| Bloom Sparkling Energy | 12 oz can | 180 mg | 15 mg |
| Energy drinks, FDA range | 8 oz | 40 to 250 mg | 5 to 31 mg |
Caffeine in Monster energy drink vs coffee is closer than most shoppers assume. Original Monster lists 160 mg in a 16 oz can, which matches the low end of a 16 oz brewed coffee. Bloom Sparkling Energy puts 180 mg into a smaller 12 oz can, so it delivers more caffeine per ounce than either.
The coffee vs Bloom energy drink matchup has a twist. Bloom lists green coffee bean extract as its caffeine source, so both drinks draw on the coffee plant. The difference is the format: a zero-sugar sparkling can against a cup you build yourself.
Across most mainstream brands, caffeine content energy drink vs coffee is similar per ounce. The gap shows up in the serving. Energy drinks come in fixed, larger cans. Coffee strength swings with the roast, the brew method and the cup size. For product teams, energy drink caffeine content vs coffee is also a labeling question, since a can prints its milligrams and a cafe cup usually does not.
Physiological impact & health effects
Caffeine is the same molecule in both drinks. Coffee vs energy drink caffeine effects come down to the dose, the speed you drink it and what else is in the container. The FDA cites 400 mg a day as an amount not generally linked to negative effects in healthy adults. That is roughly four or five cups of coffee, or two and a half cans of original Monster.
Coffee vs energy drink health effects diverge most on sugar. Full-sugar energy drinks pair caffeine with a large sugar load, which can bring a quick lift followed by a dip as blood sugar falls. Black coffee carries no sugar unless you add it, along with antioxidants that occur naturally in the bean.
A full coffee vs energy drink health caffeine comparison also covers the side effects both share. The FDA lists jitters, anxiousness, a fast heart rate, upset stomach and trouble sleeping as signs of too much caffeine. It also notes that too much caffeine in children and teens can raise heart rate and blood pressure. Coffee is naturally acidic, and carbonated energy drinks are often acidic too.
Coffee caffeine vs energy drink caffeine also differs in how much is easy to stack. A morning cold brew plus an afternoon energy drink can push you past 400 mg quickly. The FDA notes that rapid intake of around 1,200 mg can cause toxic effects such as seizures, mainly from pure and powdered caffeine.
Consumers are noticing the dose. A consumer need is the reason to buy that consumers attach to a drink, such as healthy or convenient. Across the Tastewise US consumer panel, the caffeine consumer need around coffee fell 13% over the past year. Coffee drinkers want a cup that fits their day, and that sets up the formulation story.
Formulations, ingredients & functional additives
A complete coffee vs energy drink comparison looks past caffeine to the formula. Legacy energy drinks built their name on taurine, B vitamins and sugar. Newer cans swap in zero-sugar sweeteners and add L-theanine, prebiotic fiber or botanical extracts. Coffee changes at the counter, through milks, syrups and foams.
Across the Tastewise US consumer panel, sugar is losing ground in energy drinks, down 14% over the past year. Mushroom ingredients are fading too. Lion’s mane fell 17%, mushroom overall fell 16% and cordyceps fell 14%. L-theanine, the amino acid often paired with caffeine for calmer focus, over-indexes 5.4x in energy drinks but slipped 8%. An index shows how often an ingredient appears with a topic compared with its average across beverages.
The gains sit in flavor and newer functional ingredients. NAD+ is trending up 38%. Fruit profiles are moving fastest, with sweet cherry up 162%, yuzu pineapple up 158% and cherry lime up 100%. This is where the energy drink vs coffee comparison matters most for R&D, because energy drink flavor is changing quickly.
The shelf points the same way. Sugar free appears on 83 new US energy drink launches in the past 12 months, against 49 for natural. Brands are betting on zero sugar ahead of clean-label botanicals.
On the coffee side, the formula action is in the add-ins. Cold foam is up 32%, salted honey is up 168% and miso caramel is up 49%. Pumpkin spice fell 18% and oat milk fell 26%. If you build coffee drinks, sweet and salty toppers are where consumers are moving.
For the flavors and formats set to shape next year’s launches across both categories, the 2027 food trends forecast maps what is coming.
How Tastewise uses data-driven insights to predict beverage trends
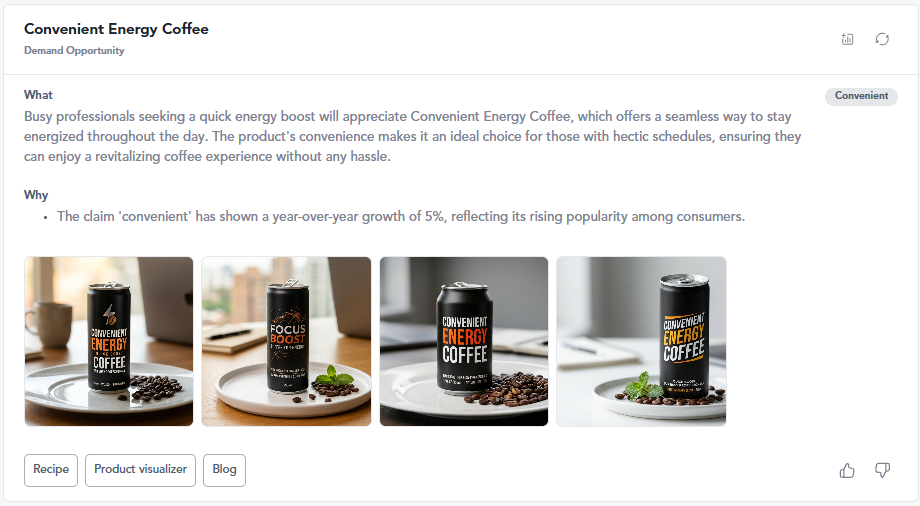
Tastewise reads consumer social signals, home recipes and restaurant menus as one dataset, refreshed daily, so you can see energy drink vs coffee demand as it shifts. Tastewise is the proactive AI food and beverage intelligence system that delivers before you ask. A cold brew can show up in a TikTok caption, a home recipe and a cafe menu line. Tastewise reads all three as one story, then sets it in the context of your category.
Here is what that view shows right now. Across the Tastewise US consumer panel, coffee holds nearly 3 in 10 points of US consumer interest in beverages (28%). Energy drinks hold 3.5%. Both dipped over the past year, energy drinks by 6.1% and coffee by 1.4%. Recipes move slowly in both: coffee recipe interest held flat while energy drink recipe interest dipped 0.6%. Menus are where the categories pull apart, with energy drinks growing faster than coffee.
Clean energy & nootropic demand
Consumers still want focus without jitters, but the reasons they give for choosing an energy drink are shifting. Within energy drinks, the natural consumer need fell 31%. Wellness fell 18% and fitness fell 21%. Celebration rose 33% and fun rose 11%. Energy drinks are being chosen for the occasion more than for wellness.
The audience behind the category explains the pull toward hybrid drinks. Energy drinks over-index 4x among Protein Prioritizers, 3.4x among On The Go Snackers and 3.3x among GLP-1 consumers. These consumer segments want function in a convenient format. A coffee-derived energy can, like Bloom, sits where those needs meet.
Coffee consumers want the same ease from their cup. Around coffee, the convenient consumer need rose 29%, easy rose 38% and quick rose 26%. Comfort rose 39%, which shows coffee working as a ritual as much as a fuel. For product innovation teams, that makes ready-to-drink coffee with comfort flavors a strong place to start the next launch cycle.
Foodservice & on-the-go innovation
On menus, cold brew is the growth format to watch. Cold brew menu items grew 27% in a year, and consumer interest in cold brew rose 7.7%. The average cold brew item now costs $6.00, up 7.5%. Nitro cold brew sits higher still at $6.76 per item, and its menu items grew 14%. Consumer interest in nitro fell 10%, so the premium nitrogenated pour has more reach than pull.
Energy drinks are moving onto menus too. Red Bull’s menu presence grew 4.4% over the past year, at an average item price of $5.47. For foodservice operators, cold brew is the higher-ticket caffeine play, at about $0.53 more per item than Red Bull drinks.
Off the menu, energy drink demand is heading to the convenience store cooler. Energy drink interest rose 151% among Circle K shoppers and 137% among Speedway shoppers. That makes the single-serve c-store slot central to any retail sell-in story for a new can.
Real-world success: driving functional beverage growth through AI analytics
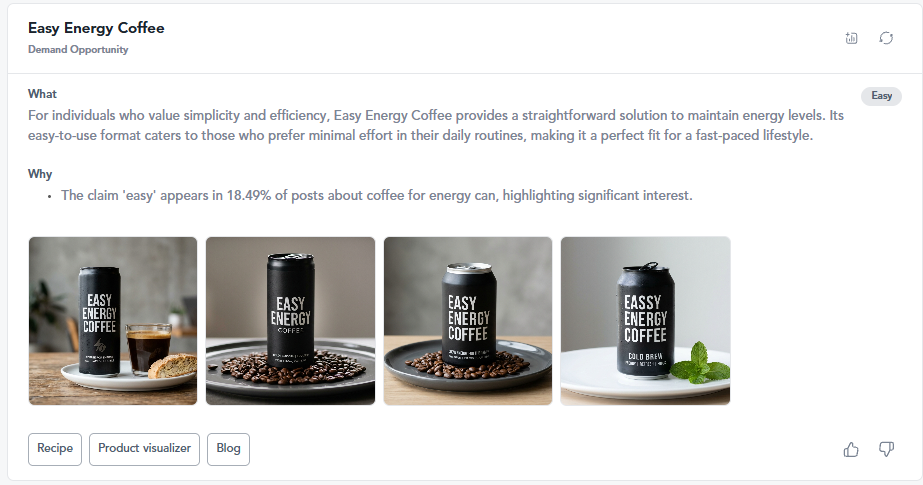
Beverage brands and ingredient suppliers use Tastewise to test which flavors, claims and formats are gaining before they commit to a launch. That lets teams validate a flavor profile, choose the functional claim to lead with and walk into a buyer meeting with evidence. Here is how that works for a typical enterprise ready-to-drink brand.
The brand has one launch slot next year. Its team must choose between a functional cold brew and a plant-based energy drink. Both fit the brand, so the decision rests on which route current US demand supports.
The cold brew route has momentum on menus. Operators now carry more cold brew items each, up 9% over the past year. The sweet add-ins consumers want are clear: butter pecan is up 38%, sweet cream is up 18% and vanilla sea salt is up 53%. A sweet cream cold brew with a vanilla sea salt finish matches what consumers are already choosing.
The plant-based energy route carries more risk on its claims. Within energy drinks, the healthy consumer need fell 38%. Plant ingredients that once carried the wellness story are declining, with beetroot down 19% and sea moss down 10%. A plant-based can sold on wellness alone would lead with needs that are losing ground.
If the team still picks the energy drink, the data points to flavor and zero sugar. Sour apple is up 43% and acai is up 18% in energy drinks. Fun is a growing need, so a sparkling, fruit-forward can with a clear sugar free claim fits demand better than a botanical wellness pitch.
With Tastewise, AI agents can watch both categories and send the team a new item one-pager when one route pulls ahead. Every figure carries its source, so the case holds up with leadership and with retail buyers. That is the practical answer to energy drink vs coffee for a brand: follow the consumer need that is growing, then build the product around it.
FAQs about energy drink vs coffee
An 8 oz cup of brewed coffee has about 80 to 100 mg of caffeine. Energy drinks range from 40 to 250 mg per 8 oz, according to the FDA.
Because energy drinks usually come in 12 oz or 16 oz cans, a single can often matches or beats a standard cup of coffee.
Original Monster has 160 mg of caffeine in a 16 oz can. That is about the same as two 8 oz cups of brewed coffee.
Bloom Sparkling Energy has 180 mg of caffeine in a 12 oz can, more than a 12 oz coffee at about 120 to 150 mg. Bloom’s caffeine comes from green coffee bean extract.
Black coffee has no sugar and contains naturally occurring antioxidants, so it is the simpler choice for most adults. The caffeine limit is the same for both, with the FDA citing 400 mg a day for healthy adults.
Sugar-free energy drinks close part of the gap on sugar. Consumers are moving that way too, with sugar down 14% in energy drinks across the Tastewise US consumer panel.
Coffee holds about 8x the US consumer interest of energy drinks across the Tastewise US consumer panel. Energy drinks are gaining menu presence faster, at 4.3% growth against 3.2% for coffee.
The caffeine works the same way in both, so the energy drink vs coffee difference in effects comes from dose and sugar. A full-sugar energy drink can bring a sharper lift and dip, while black coffee delivers caffeine with no added sugar.

Read more from Kelia Losa Reinoso


We’d love to learn your goals and see how Tastewise fits
We’d love to learn your goals and see how Tastewise fits
Get a personalized demo
Good taste. Wise move.
Your demo request is confirmed. We’ll reach out within one business day to schedule your walkthrough.
What happens next

See what’s driving demand, then turn it into a sell-in story for retailers and operators.
- Connect consumer panels, market trackers, and agents into one evidence view
- Get the “why” behind what’s changing, with explainable demand drivers
- Walk away with a buyer-ready narrative and next steps to activate
Trusted by


“Tastewise is my secret tool for knowing what consumers want next and why.“