





Your beverage display is often the first menu a guest reads. B2B beverage display stand market trends 2026 point to one problem for foodservice operators: guests now choose drinks by the benefit they want, and many displays still reflect last year’s best sellers.
Consumers now shop for functional beverages by benefit, according to Fast Company’s functional beverages analysis, which cites North American sales of around $58 billion in 2025. Across the Tastewise US consumer panel, calm reaches 0.9% of US beverage consumers and grew 34% in the past year, faster than energy at 24%.
B2B beverage display stand market trends in 2026 reflect three things coming together: automated physical merchandising, digital menu boards and real-time consumer preference tracking. For foodservice operators, they mark a shift toward placing functional smart drinks at the guest touchpoints that sell. Tastewise connects those merchandising decisions to live consumer demand, so you know what to feature and what to pull.
Key takeaways
- Energy has the widest reach of any functional benefit, at 4.3% of US beverage consumers, up 24% in the past year.
- Weight management fell 43% and general “healthy” claims fell 24% among US beverage consumers, which makes them the first signs to retire.
- Millennials are 1.46 times more likely than the average US consumer to engage with functional beverages, and Gen Z are 1.33 times more likely.
- Matcha is on nearly 1 in 10 US restaurant menus (8%), up 15% in a year, with its average price flat at about $7.90.
- CBD is on 0.03% of US restaurant menus and fell 11% in a year, at an average of $12.57 per item.
- Speedway shoppers are 2.18 times more likely than average to engage with functional beverages, and that group grew 122%.
How are functional smart drinks reshaping B2B beverage display stand market trends 2026?
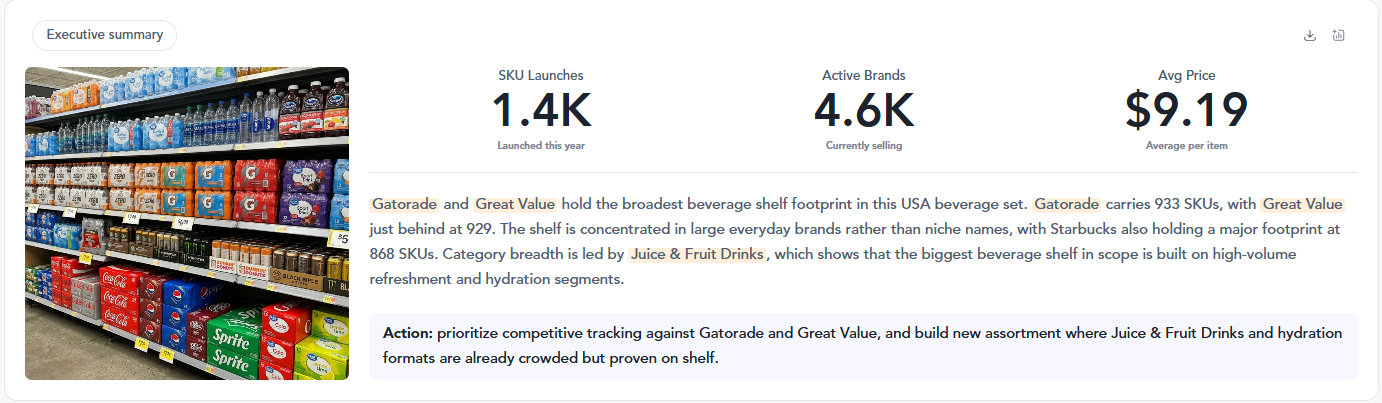
Functional smart drinks are pushing benefit-led categories such as energy, calm and plant-based options to eye level on physical stands and digital ordering kiosks. When your display matches the benefits consumers are choosing now, guests get a faster reason to buy.
The benefits gaining ground are energy and calm. Digestion fell 16% and mental health claims dropped 25%. That split tells you which shelf talkers and kiosk tiles have earned their space in B2B beverage display stand market trends 2026.
What health benefits are driving Gen Z and Millennial beverage choices?
Millennials and Gen Z over-index on functional beverages, so their choices shape what a display leads with. Matcha reaches 0.63% of US beverage consumers and grew 17%. Cold foam grew 43% and NAD+ grew 17%. Strawberry hibiscus grew 307%, from a very small base, which marks it as an early signal worth a test.
Some of the ingredients that filled wellness menus a few years ago are now fading. CBD fell 29%, protein powder fell 23%, turmeric fell 22% and sea moss fell 21%. Protein is moving into new formats on menus, such as the Frozen Sunrise with Protein Cold Foam that Black Rock Coffee recently added. You can track how these shifts play out across the wider functional beverages market.
How do physical and digital beverage displays adapt to health-conscious trends?
Displays adapt by making the benefit easy to read and easy to swap. Modular panels let you replace a fading claim with a rising one without rebuilding the stand. Chilled impulse zones near the register suit grab-and-go energy drinks. QR codes on stands and kiosk tiles can carry ingredient and benefit details that would crowd the front panel.
Convenience stores show where this is heading. Speedway shoppers over-index on functional beverages more than any other audience, and c-store chains already sell cafe-style drinks. Wawa lists a Vanilla Cold Foam Cold Brew at $5.79, and Sheetz sells its Sh’morez Iced Latte at $3.99.
Why is data analytics essential for beverage menu optimization in 2026?

Data analytics shows you which benefits, flavors and formats are gaining consumers and which are losing them. That tells you what to add to a display, and what to take off before it ties up space and stock.
Matcha and CBD show the gap. Operators that carry matcha now list close to 6 matcha items each, up 82% in a year, without raising the average price. CBD is losing menus while still priced above $12 per item. One is earning more space. The other ties up space that fewer guests want.
What key consumer behavior metrics should foodservice operators track?
Track two sets of numbers. Your POS holds daypart order volume, plant-based milk swap ratios and display conversion rates. Outside demand data holds the rest:
- Benefit reach and growth among a defined consumer group.
- Ingredient lifecycle stage, from early to declining.
- Rising flavor pairings, such as peach hibiscus, pineapple jasmine and cardamom pear.
- Menu adoption and average price for items you plan to add.
How does Tastewise AI translate raw consumption signals into merchandising clarity?
Tastewise is the proactive AI food and beverage intelligence system that delivers before you ask. It resolves the US consumer panel, home recipes and menus from more than 4 million operator locations into one dataset. Wise, its food ontology, reads a cold foam latte on a menu and in a consumer’s photo as one story.
For a beverage team, that means knowing what is rising and what is losing consumers. The second matters as much as the first, because a slot holding CBD is a slot your rising drinks cannot use. Tastewise AI agents can watch your categories and flag when a benefit or ingredient changes stage. Distributor and supplier teams use the same read for foodservice sales enablement with operators.
How can operators execute data-driven strategies for beverage success?
You execute a data-driven beverage strategy by pairing outside demand data with your POS and inventory numbers. Test new drinks in small runs, then update displays as the data moves. Each reset should add a rising item and remove a fading one.
How do restaurant chains optimize beverage displays for peak dayparts?
Take a fast-casual chain deciding what goes on its morning and afternoon display panels. Its POS shows when drinks sell. Tastewise shows which benefits guests want in those slots. Energy has the widest reach among US beverage consumers, so the morning panel leads with matcha and cold foam drinks. Calm is the faster-growing benefit, so the afternoon panel tests hibiscus refreshers, with strawberry hibiscus as a small-batch trial.
Real menus show both formats. Scooter’s Coffee ran a Grape Rush Red Bull Infusion as a limited-time drink at $10.37, and McAlister’s Deli added a Strawberry Lemonade with Cold Foam at $6.59. The chain’s team updates its digital boards by daypart and checks sell-through weekly.
What tools enable continuous data collection for beverage merchandising?
Continuous collection needs three tools working side by side. Your POS records what sold and when. Your inventory system tracks stock and waste for each SKU, so top sellers get replenished. A demand intelligence system tells you what consumers want next. Tastewise agents send that read to where your team works, including Slack, Salesforce and Power BI. For the operator view of the year ahead, the foodservice forecast covers menu trends beyond beverages.
5 steps to optimize your beverage menu using data analytics
- Identify key data points to track. Pair POS daypart volume and attach rates with outside benefit reach and ingredient lifecycle stage.
- Select appropriate analytics tools. Use one tool for your sales and one for consumer demand, and set both to the same 12-month window.
- Analyze consumer behavior patterns. Compare reach with growth, because a benefit like calm can reach fewer consumers and still grow faster.
- Adjust menu offerings based on insights. At each reset, add one rising item such as matcha or cold foam and remove one declining item such as CBD or sea moss.
- Monitor performance and make iterative improvements. Recheck sell-through and demand data every quarter, and move fading claims off the front panel first.
The menu planning guide covers how this process works across the full menu.
What B2B beverage display stand market trends 2026 mean for your next reset
B2B beverage display stand market trends 2026 reward operators who know both what to add and what to remove. Energy and calm are gaining consumers, matcha is spreading across menus and CBD is fading. Use your own sales data for timing, and use consumer demand data to decide what earns a place on the stand.
FAQs about B2B beverage display stand market trends 2026
Displays are moving toward benefit-led layouts that put rising functional drinks at eye level. Across the Tastewise US consumer panel, wellness held flat at 2% growth while hydration slipped 6%, so growth sits in a few specific benefits.
Feature drinks built on ingredients that are still trending among US beverage consumers. Bergamot grew 17%, black cherry grew 11% and hibiscus grew 8%, which makes them strong candidates next to matcha.
Start with ingredients in decline. Among US beverage consumers, agave fell 11%, aloe vera fell 10% and magnesium fell 16%, so these are the first slots to reassign.
Coffee drinkers lead it. Coffee lovers are 1.63 times more likely than average to engage with functional beverages. Dunkin customers are 1.22 times more likely than average to engage with functional beverages, and that group grew 8% in the past year.
Tastewise shows which benefits, ingredients and drinks are gaining or losing US consumers, and how they perform on menus. Its data covers 72 markets, 27 of them with foodservice data alongside consumer data.


We’d love to learn your goals and see how Tastewise fits
We’d love to learn your goals and see how Tastewise fits
Get a personalized demo
Good taste. Wise move.
Your demo request is confirmed. We’ll reach out within one business day to schedule your walkthrough.
What happens next

See what’s driving demand, then turn it into a sell-in story for retailers and operators.
- Connect consumer panels, market trackers, and agents into one evidence view
- Get the “why” behind what’s changing, with explainable demand drivers
- Walk away with a buyer-ready narrative and next steps to activate
Trusted by


“Tastewise is my secret tool for knowing what consumers want next and why.“