





Functional beverage market growth in 2026 comes down to one clear shift. US shoppers now pick drinks for what they do, from calm and focus to gut support and steady energy. Tastewise social data for US beverages shows calm is the fastest-rising benefit, up 44% over the past 12 months. Energy is still the biggest, appearing in 4.2% of beverage social posts and climbing 30%.
Annual category reports capture moves like these months after they start. Real-time AI analytics reads social, menu and recipe signals as they happen. That gives you time to match products to shifting consumer need-states while the window is still open. This guide covers what drives functional beverage market growth trends, how to track them and how to turn them into launches.
Key takeaways
- Calm is the fastest-growing functional benefit in US beverage social posts, up 44% in 12 months.
- Energy is the largest need-state, present in 4.2% of beverage posts, and clean energy is rising at the same 30% pace.
- Prebiotic items appear on 0.34% of US restaurant menus, and that menu share grew 46% while prebiotic social buzz dipped 8%.
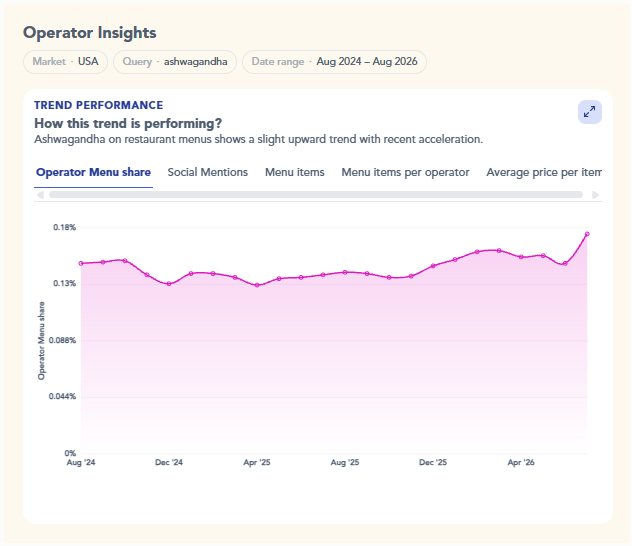
- Ashwagandha is cooling, with its share of functional ingredient posts down 24%, while NAD+ nearly doubled.
- GLP-1 consumers over-index on functional beverages by 26%, and their presence in the category grew 18%.
- Collagen menu items jumped 56% in a year, and collagen now reaches 0.76% of US restaurants.
What factors are driving functional beverage market growth?
Functional beverage market growth is driven by rising consumer demand for preventative health, gut wellness, stress management and low-sugar hydration. By using real-time behavioral data instead of static surveys, beverage brands can track shifting ingredient popularity and align product lines with how consumers actually live.
The sales numbers point the same way. PepsiCo’s fitness water Propel was on track to pass $1 billion in annual retail sales. Its prebiotic soda poppi grew retail sales more than 50% through the third quarter of 2025, according to an analysis of PepsiCo’s 2025 beverage results. Both brands sell a specific benefit first and refreshment second.
The shift from general wellness to targeted functionality
Generic “healthy” claims carry little weight in 2026. The broad better-for-you claim holds just 0.03% of US beverage social posts. Calm alone draws about 30 times that share, and energy draws far more.
The ingredients behind those benefits are rotating fast, which is reshaping functional beverage market size growth. Within social posts about functional beverage ingredients, ashwagandha’s share fell 24% over the past year. Rhodiola dropped 38% and shilajit dropped 48%. Meanwhile NAD+ rose 92%, blue algae rose 53% and polyphenols rose 34%.
Functional mushrooms show the same split. Shiitake grew 31% and maitake grew 18%, while lion’s mane slipped 3% and cordyceps held flat. Calm demand keeps climbing even as the classic adaptogens fade. That tells you shoppers care more about the benefit than the botanical behind it.
Decoding real-time consumer need-states
AI tracks consumption moments month by month, which is where functional beverage market growth trends become usable. Calm peaked in January at 1.4% of US beverage posts, during the post-holiday reset, then eased to 0.6% by July. Energy hit its own January high of 4.8% before settling at 3.5%. Timing like this tells you when a calm or focus message should lead on shelf.
Occasion data adds another layer. Coffee lovers over-index on functional beverages by 52%. Dunkin consumers over-index by 21%, and their share of the category grew 8%. Functional benefits are winning inside the morning coffee routine first, so that is the easiest place to add a new one.
How can beverage brands track functional beverage market size growth trends?

Beverage brands track functional beverage market size growth trends by analyzing real-time social conversations, restaurant menu additions and online recipe integration. Synthesizing these multi-channel data points lets CPG innovators separate short-term viral spikes from sustained, long-term market demand.
The Tastewise consumer insights platform reads social, menu, recipe and retail shelf data side by side. R&D and brand strategy teams can see where a functional ingredient stands in each channel before it reaches mass retail. Ashwagandha, prebiotic fiber and functional mushrooms each tell a different story once you line the channels up.
Quantifying category expansion with precision data
Break the category into its sub-categories and the growth rates separate clearly. In gut health, prebiotic menu share grew 46% and the number of prebiotic menu items grew 73%. In natural energy, clean energy posts rose 30% and green coffee bean rose 40%. In cognitive support, lion’s mane has matured while NAD+ is the ingredient gaining ground.
Each sub-category calls for a different move. Gut health is ready for scale. Natural energy rewards cleaner caffeine sources. Cognitive support rewards whoever moves on the next ingredient before the current one plateaus.
Validating trends with functional beverage market growth statistics
Social volume alone can mislead you. Prebiotic social share fell 8% over the past year, but its restaurant menu share grew 46%. Prebiotic now reaches twice as many US restaurants as ashwagandha and is growing on menus nearly seven times faster. Ashwagandha’s menu share rose only 7%.
When buzz and menus move in opposite directions, the gap is the signal. Prebiotic appears to have moved past its buzz phase into routine menu use. Collagen shows a similar pattern, with menu share up 27% and its reach now at 0.76% of US restaurants. Combining these functional beverage market growth statistics gives you evidence a retail buyer or finance team can check.
How do real-time insights accelerate functional beverage product development?

Real-time insights shorten every phase of functional beverage product development. At ideation, lifecycle data shows which ingredients are trending and which are declining. NAD+ and polyphenols are rising, while rhodiola is fading. At formulation, need-state data shows which benefit to lead with and in which format. At commercialization, menu growth gives you the proof for retail sell-in and operator pitches.
Feeding these signals into your innovation pipeline keeps each launch tied to functional beverage market growth as it happens.
Aligning formulations with consumer lifestyle priorities
Match the benefit to the audience that is already buying. Millennials over-index on functional beverages by 20% and make up 22% of the category’s social audience. GLP-1 consumers over-index by 26%, and posts about weight loss drugs in beverages grew 21%. Starbucks consumers account for nearly 1 in 4 functional beverage posts (23%).
That points to specific launches. Test a protein or fiber drink in small serving sizes built for GLP-1 users. Pair a calm claim with a low-caffeine coffee format for Millennials who want the coffee ritual without the jitters. Map each idea to defined consumer segments before you brief formulation.
Continuous market monitoring vs. annual category reports
A report built on last year’s data would still name ashwagandha as the leading stress ingredient. Its share of functional ingredient posts has since fallen 24%. A yearly average would also hide the calm cycle, which more than halved between January and July.
Use a yearly view such as the 2026 trend forecast for direction. Then track the monthly signals with always-on intelligence so your next launch reflects functional beverage market growth this month, ahead of the next annual report.
FAQs about functional beverage market growth in 2026
Demand for specific benefits like calm, energy and gut health is driving growth. Newer needs are rising too, with “glow from within” beauty posts in US beverages up 21% over the past year.
Anthocyanin, lime mint and ginger lemon are among the fastest risers. Anthocyanin posts nearly tripled, lime mint grew 72% and ginger lemon grew 52% in US functional beverage social data.
Several established botanicals are losing share. Ginseng fell 29%, chlorophyll fell 30% and MCT oil fell 28% among US functional beverage ingredient posts over the past year.
Menus show demand when operators add more items, beyond adding the ingredient once. US operators that serve collagen now list an average of 2.2 collagen items each, up 10% in a year.
Coffee drinkers lead, but some audiences are less expected. Beer lovers over-index on functional beverages by 37%, and Target shoppers over-index by 21%.
Review them monthly, because functional signals swing within a single year. Collagen’s share of US social posts peaked in January 2026 and fell by more than 40% by August.



We’d love to learn your goals and see how Tastewise fits
We’d love to learn your goals and see how Tastewise fits
Get a personalized demo
Good taste. Wise move.
Your demo request is confirmed. We’ll reach out within one business day to schedule your walkthrough.
What happens next

See what’s driving demand, then turn it into a sell-in story for retailers and operators.
- Connect consumer panels, market trackers, and agents into one evidence view
- Get the “why” behind what’s changing, with explainable demand drivers
- Walk away with a buyer-ready narrative and next steps to activate
Trusted by





“Tastewise is my secret tool for knowing what consumers want next and why.“