





Retail data trend analysis using AI is how a category team sees demand forming before it shows up in a sell-through report. A planogram decision made on last quarter’s scan data is a bet on a market that has already moved on. That gap costs more in 2026, because retailers are cutting slow SKUs faster while grocery pricing stays tight. The USDA Economic Research Service Food Price Outlook puts food-at-home prices up 2.3% for the year against 3.3% for food away from home. Cheaper groceries pull volume back into the store and raise the bar on every listing decision. This guide covers what the method is, how three retail teams use it, and how the prediction layer works underneath.
Key takeaways
- The anchor claim in a category is usually the weakest thing to pitch. In the US functional hydration set, electrolytes appear in nearly all of the demand signal (96%) and hydration in 2 in 3 (67%), and both moved less than half a percentage point against last year. The argument sits in the occasion underneath, where the afternoon daypart is up about 34% and the calm need state about 69%.
- Protein has become category entry rather than differentiation. High protein reaches nearly 3 in 4 of the US snacking set (76%) and is flat, so the separation comes from texture and treat framing. Intense flavor is up about 67% and the snack plate occasion about 121%.
- Claim vocabulary turns over faster than the shopper motivation behind it. Keto is down about 57%, low carb about 43% and weight management about 40%, while protein and fiber framing absorb the same need. Pack copy written to last year’s vocabulary ages faster than the product does.
- Divergence between at-home and menu signals is the lead indicator worth acting on. In the bold condiment set of chili crisp, gochujang and hot honey, demand is up about 18% while menu incidence for the same items fell about 8%. That gap points to a retail-first opportunity, and the reverse pattern points to a foodservice-first one.
- Velocity without reach is a watchlist item, not a listing argument. Anthocyanin signals in the hydration set are up about 250% from a base under half a percent of the set. Convenience at about 19% of the same set, growing about 20%, is the one you can take to a buyer.
Retail data trend analysis using AI, defined
Retail data trend analysis using AI is the automated collection and machine-learning synthesis of live consumer demand indicators, including restaurant menu adoption, home recipe activity, social consumption behavior and retail shelf data. The output predicts emerging product, flavor and format shifts before they surface in traditional POS reporting.
The practical value sits in sequence. Scan data tells you a SKU sold. Demand signals tell you which occasion pulled it off the shelf, which claim carried the decision, and whether that occasion is picking up or fading. Buyers do not argue with velocity. They argue with the story you attach to it.
Difference between retail trend forecasting AI and legacy POS tracking
POS tracking is a rear-view instrument. It is accurate, auditable and several weeks behind the shopper. It also cannot explain substitution, because it only sees the item that won. Retail trend forecasting AI reads the demand around the purchase instead of the purchase alone, which is what makes a retail shelf strategy defensible in a category review rather than descriptive.
The two are complementary. Scan data validates what happened. Demand signals explain why, and point at what is forming next. Teams that bring only the first into a buyer meeting end up negotiating on price.
Where each method succeeds and where it falls short
Point of sale tracking records the quantity, price and timing of items scanned at checkout. It is accurate, auditable and backward looking. It tells you what sold, and it carries no view of the demand that no listed product was able to absorb.
Retail trend forecasting AI reads demand signals from several behavioral streams at once, covering restaurant menu adoption, home recipe activity, social consumption behavior and retail listings. Those streams are modeled into a read on which occasions, claims and formats are gaining ground across the Tastewise US consumer panel, ahead of the point where they reach transaction data. The output is a demand signal rather than a sales figure, so it describes what shoppers are pulling toward and not what a register has already counted.
On timing, POS data arrives after the transaction clears, usually several weeks later, and each release describes a window that has already closed. Demand signals update continuously as behavior shifts, so the read you carry into a category review reflects the current quarter.
On the unit of measurement, POS counts transactions at store level for items that were stocked. Demand signals measure interest in flavors, claims, formats and occasions, which is a different unit answering a different question. A claim can be moving hard while the SKU carrying it sits flat, and only the second unit shows you that.
On substitution visibility, scan data sees the item that won and nothing about what the shopper weighed against it. Demand signals hold the wider preference set. Inside the US functional hydration set the legacy end is giving way, with Gatorade signals down around 23% and coconut water off roughly 14%, which is the kind of movement that explains a flat SKU rather than only recording it.
On unlisted product insight, a category cannot show sell-through for a format nobody has listed yet. That is where a whitespace argument comes from. Refresher formats are up about 67% in the same hydration set, which names a format worth building before any scan report can price it.
On occasion-level granularity, POS records a purchase without the reason behind it. Demand signals attach the occasion, so you can separate a weekend dinner moment from an afternoon routine. In the bold condiment set, comfort framing is up about 49% and the weekend dinner occasion about 25%, and those two figures move both the shelf placement and the pack copy recommendation.
When to rely on scan data and when to rely on demand signals
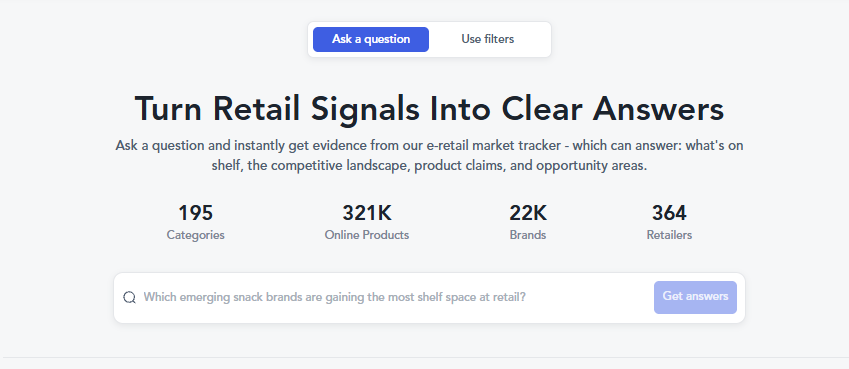
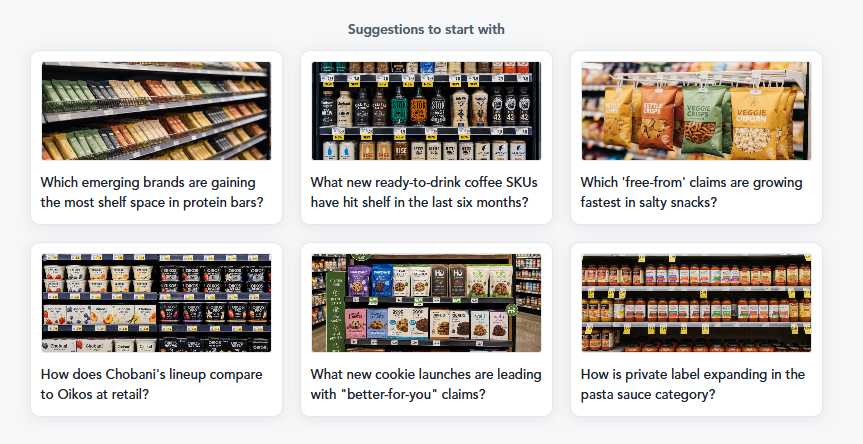
Scan data is the right instrument for validating performance, negotiating on velocity and auditing promotional lift. It is the proof layer, and a buyer will accept it as one. Demand signals are the right instrument earlier in the cycle, when you are building a line review argument, sizing whitespace, localizing assortment by banner or justifying a cross-merchandising placement before there is sell-through to quote. Live retail shelf data sits between the two, covering assortment, pricing and claims across more than 350 US retailers, so you can see what is already listed while the demand read tells you what is forming.
The strongest category presentations carry both. Scan data supplies the validation layer, showing that a format or claim already performs. Demand signals supply the forward layer, showing that an occasion is building and naming the format positioned to capture it. Teams that bring one and leave the other behind arrive with half an argument.
Core data inputs in AI tools for trend analysis in retail
AI tools for trend analysis in retail evaluate several streams at once. Tastewise runs on more than 1 trillion structured food and beverage data points, over 4 million operator locations and 38 live markets. That covers menu incidence at chain and independent level, home cooking behavior, social consumption signals and retail product listings, with agentic AI layered on top to turn the read into output a rep can carry into a room.
Two inputs matter most for shelf work. Menu incidence shows where a flavor has already been paid for outside the home. At-home signals show whether the same flavor has crossed into weekly cooking, which is the point where a retail listing starts to make sense.
The category, trade and shopper checklists behind the arguments in this article sit in the retail playbook.
Retail team scenarios in practice
The three scenarios below use real movement from the Tastewise US panel over the trailing twelve months. Each one starts from the same problem, which is that the headline term in a category is usually the least useful thing to pitch.
Line review built on category demand data
A beverage category manager preparing an annual line review wants to argue functional hydration. Within the US functional hydration and electrolyte set, electrolytes appear in nearly all of the demand signal (96%) and hydration in roughly 2 in 3 (67%). Both are flat against last year, at less than half a percentage point of movement either way. A pitch built on those two words tells the buyer nothing a competitor cannot also say.
The movement sits in the occasion instead. Convenience is up about 20% across the same set and ease of preparation about 24%. Travel is up roughly 20% and the afternoon occasion about 34%. Calm rises about 69% and cortisol about 18%, so hydration is being bought for regulation rather than only for sport.
The legacy end of the category is going the other way. Gatorade signals are down around 23% and generic energy drink signals about 23%, while coconut water is off roughly 14%. On shelf the same set is carried by Prime Hydration, Ultima Replenisher, Propel, BioSteel and Ocean Spray Hydration. In foodservice it shows up as the Smoothie King hydration watermelon smoothie and Liquid Death sparkling water listed at Smokey Bones.
That gives the manager a specific argument. The whitespace is an afternoon calm-and-convenience format, not another sport electrolyte, and the claim to lead with is convenience rather than mineral content. Refresher formats are up about 67% in the same set, which names the format the argument should point at.
Assortment localization across retail banners
A snack brand running six banners sees performance vary and cannot explain it. In the US high-protein snacking set, high protein appears in nearly 3 in 4 of the demand signal (76%) and is flat over the year. Protein has become the entry requirement for the category rather than the differentiator inside it.
Two things are moving underneath. The restriction vocabulary is collapsing, with keto down about 57%, low carb about 43%, weight management about 40% and guilt free about 31%. Treat and texture language is rising in its place. Dessert framing is up about 21%, crunchy about 19%, intense flavor about 67%, late night about 87% and the snack plate occasion about 121%.
The channel split is what makes this localizable. Inside the same set, fiber and frozen framing skew about 62% toward at-home and retail contexts, while gluten free and low carb skew about two thirds toward foodservice. Delivery framing sits at roughly 9 to 1 in favor of foodservice. Those splits tell you which banner role a SKU can hold and which claim to print on the front of pack per banner.
The assortment call follows from the split. Lead the at-home banners on texture and treat framing with protein as a support claim, and hold the restriction language for the accounts where it still carries. Layering consumer segments on top of that read narrows the recommendation to a specific shopper rather than a region average.
Cross-merchandising case for a buyer
A condiments brand wants an end-cap next to premium proteins and does not want to buy it with promotional discount. Take the bold condiment set of chili crisp, gochujang and hot honey across the US panel. Demand signal in that set is up about 18% over the past year while menu incidence for the same items is down about 8%, so the flavor is being cooked at home faster than it is being served out.
The pairing evidence is in the claim overlap. High-protein framing inside that bold condiment set skews about 88% toward at-home and retail contexts against 12% foodservice, and it is growing about 16%. Sweet and spicy sits at roughly 3.7% of the set, the largest taste pairing in it, and is up about 53%. Garlicky is up about 30%, crunchy about 33% and small batch about 68%.
That is a buyer argument built on adjacency rather than instinct. Shoppers reaching for chili crisp and hot honey are doing so around home protein cooking, at a moment when restaurant menus have not caught up. Comfort framing in the set is up about 49% and the weekend dinner occasion about 25%, which dates the end-cap to the part of the week the occasion actually lives in.
These cuts can be run against your own categories, banners and accounts.
Mechanics of AI-powered trend prediction in retail sales
Prediction in this context is not a forecast of a number. It is a read on whether an occasion, claim or flavor is gaining ground, how broadly, and how durable the need behind it looks. Four parts do the work.
Predictive demand signals compared with POS data
POS answers what sold. Predictive demand signals answer what is about to sell and why. The distinction is the unit of measurement. Scan data measures transactions after the fact, at store level, for items that were stocked. Demand signals measure interest in flavors, claims, formats and occasions, including combinations no retailer has listed yet.
That last part is the commercial point. A category cannot show sell-through for a product that does not exist on shelf. The functional hydration read above found an afternoon occasion up about 34% and a calm need state up about 69%, in a category whose two anchor claims were flat. No POS report contains that sentence, because no POS report can see an occasion.
Velocity without reach is also a trap. A claim growing 90% that touches a fraction of a percent of a category is a test, not a listing. Reach and velocity have to be read together, which is the discipline behind every retail sales enablement software argument that survives contact with a buyer.
Data sources behind the predictions
Four streams feed the read. Menu incidence across operator locations shows paid-for demand outside the home, at chain and independent level, with pricing attached. Home cooking activity shows whether a flavor has entered weekly rotation. Social consumption signals show the occasions and claims consumers attach to it. Retail product listings show what is already on shelf and at what price.
Reading them against each other is what produces a lead indicator. In the bold condiment set, at-home demand rising about 18% while menu incidence falls about 8% is a divergence, and divergence is the signal. The flavor is being adopted in kitchens ahead of menus, which is a retail-first opportunity rather than a foodservice-first one.
The reverse pattern reads differently. When menu incidence leads and at-home activity lags, the flavor is still being learned in restaurants and a retail listing is early. Same data, opposite recommendation, and the direction of the gap is what tells you which.
Signal to retail action
A signal becomes commercial when it names four things. Which SKU to prioritize. Which claim to lead with on pack and in the deck. Which account to approach first based on shopper profile. And what timing the current velocity supports.
An early-stage signal argues for a limited format or a single-banner pilot. A signal at scale argues for permanent facings and a claim on the front of pack. The high-protein snacking read is a scale signal, since protein reaches nearly 3 in 4 of that set, so the argument there is about differentiation rather than category entry. The afternoon hydration occasion is an emergence signal, so the argument is a pilot.
The same read feeds forward into product innovation work, because the claim that wins a buyer meeting is usually the claim that should have shaped the concept. Teams running the two separately end up pitching a product built for last year’s occasion.
Trend signal against trend noise
Not every rise becomes a category. Three parameters separate the two. Velocity is the rate of change in the demand signal. Breadth is how many markets and shopper groups it reaches. Longevity sits in whether the need underneath it is durable, which is why functional health signals behave differently from novelty flavor signals.
Breadth is the parameter most often skipped. Cane juice signals in the hydration set are up about 117% and anthocyanin about 250%, both from a base under half a percent of the set. Those are worth a watchlist and nothing more. Convenience at about 19% of the same set, growing about 20%, is a listing argument, because the reach is there alongside the movement.
Longevity is where the restriction vocabulary in snacking becomes instructive. Keto and low carb are both falling by more than 40% against last year, after several years of growth. The need they served did not disappear, it moved into protein and fiber framing. Broader shifts of that shape are tracked across supermarket food trends, where claim language turns over faster than the underlying shopper motivation.
Running all three parameters is what separates a trend read from a trend list, and it is the core of how retail sales enablement work gets built at Tastewise. The output is a sell-in story a buyer can act on rather than a chart pack.
Your next line review can be built on live demand signals rather than last quarter’s scan data.
Frequently asked questions about retail data trend analysis using AI
It is the automated synthesis of live consumer demand indicators into a read on what will sell next. The inputs are menu incidence, home cooking activity, social consumption signals and retail listings. In practice it surfaces what scan data cannot, such as the afternoon hydration occasion rising about 34% in a category whose anchor claims were flat.
POS measures completed transactions for items already on shelf, weeks after they happen. Retail trend forecasting AI measures demand around the purchase, including combinations no retailer has listed. The bold condiment set illustrates the difference, with at-home demand up about 18% while menu incidence fell about 8% over the same period.
Menu incidence across operator locations, home recipe and cooking activity, social consumption signals and retail product listings. Tastewise reads these against more than 1 trillion structured food and beverage data points and over 4 million operator locations across 38 live markets.
By replacing the category headline with the moving occasion underneath it. In functional hydration the anchor claims moved less than half a percentage point, while convenience rose about 20% and the calm need state about 69%, which is the argument a buyer has not already heard from three competitors.
By reading the at-home against foodservice skew on each claim. In high-protein snacking, fiber and frozen framing skew about 62% toward at-home contexts while gluten free and low carb skew roughly two thirds toward foodservice, which tells you which claim to lead with per banner.
With adjacency evidence rather than promotional spend. High-protein framing inside the bold condiment set skews about 88% toward at-home contexts and is growing about 16%, which supports an end-cap next to premium proteins on occasion logic.
Velocity, breadth and longevity read together. Anthocyanin signals in the hydration set are up about 250% from a base under half a percent, which is a watchlist item, while convenience at about 19% of the set growing about 20% is a listing argument.
Scan data arrives weeks after the transaction and counts only items that were stocked, so it shows the item that won without the alternatives a shopper weighed against it. It also records no occasion. A category cannot show sell-through for a format nobody has listed, which is why refresher formats up about 67% in the US functional hydration set read as whitespace rather than as a sales number.
Use scan data to validate performance, negotiate on velocity and audit promotional lift. Use demand signals earlier, when you are building a line review argument, sizing whitespace, localizing assortment by banner or justifying a cross-merchandising placement. In the bold condiment set, comfort framing up about 49% and the weekend dinner occasion up about 25% is evidence available before a single unit ships.




We’d love to learn your goals and see how Tastewise fits
We’d love to learn your goals and see how Tastewise fits
Get a personalized demo
Good taste. Wise move.
Your demo request is confirmed. We’ll reach out within one business day to schedule your walkthrough.
What happens next

See what’s driving demand, then turn it into a sell-in story for retailers and operators.
- Connect consumer panels, market trackers, and agents into one evidence view
- Get the “why” behind what’s changing, with explainable demand drivers
- Walk away with a buyer-ready narrative and next steps to activate
Trusted by





“Tastewise is my secret tool for knowing what consumers want next and why.“