






If you are weighing matcha vs coffee for a new beverage line, the demand data answers faster than the flavor debate does. Across the Tastewise US panel, matcha now appears inside the coffee occasion itself and is gaining ground there faster than in its home tea category. Consumers are asking a single morning occasion to deliver steady focus rather than a hard jolt, and both drinks are being reformulated to answer that. This comparison covers caffeine, health benefits, weight management, and menu adoption, with the consumer and operator numbers behind each one.
Key takeaways
- Matcha carries three to four times coffee’s share of the energy and focus signal in the Tastewise US panel, holding that lead in every month from September 2025 to July 2026.
- Coffee is chasing matcha’s positioning. Calm is coffee’s fastest-rising motivation, climbing more than four times faster than the same motivation on matcha.
- Clean energy is the shared prize. It reaches nearly 1 in 7 of the matcha functional signal (15.4%) and nearly 1 in 5 of the coffee signal (18.9%), and it is growing roughly twice as fast on matcha.
- Named functional actives are losing ground while their benefits gain it. L-theanine sits in a declining lifecycle stage. So do ginseng, ashwagandha, guarana and lions mane, even as clean energy climbs.
- Matcha has distribution without depth. It appears on the menu at 1 in 3 of the chains that serve coffee, yet accounts for nearly 1 in 9 of their beverage menu items (11.6%).
- The formulation risk is dose, not concept. Trial evidence puts meaningful catechin effects above roughly 300 mg of EGCG a day, which is far more than a standard serving delivers.
What is the difference between matcha and coffee?
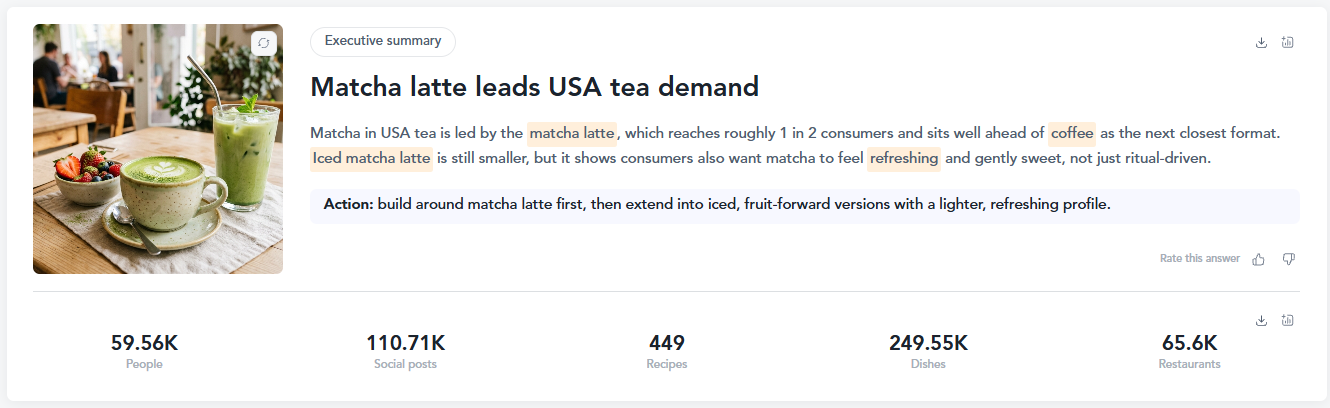
Both drinks deliver caffeine, and they deliver it from different plant matter in different amounts. Coffee is an extract. You brew roasted beans in hot water and drink the liquid, leaving the grounds behind. Matcha is the whole leaf, shade grown and stone ground, whisked into water so you swallow every part of it.
That difference shows up in what else comes along with the caffeine. A published assay of native matcha measured 16.1 mg of caffeine and 9.85 mg of l-theanine per gram of powder, which puts a two gram serving at roughly 32 mg of caffeine. Coffee arrives with a different compound set and, in most preparations, a higher caffeine load per cup.
For anyone working in product innovation, the useful question is not which drink is better. It is which drink is winning the occasion, and the Tastewise panel has a clear answer on that.
Energy delivery, l-theanine and caffeine kinetics
Matcha green tea vs coffee is fundamentally a question about the shape of the lift, and consumers treat it that way. Across the Tastewise US panel, energy is the dominant motivation attached to matcha beverages, reaching nearly 2 in 3 of the tracked functional signal (63.8%) and rising against last year.
The mechanism has real trial support, though narrower than the marketing around it suggests. In a double-blind crossover study of 37 sleep-deprived adults, a combination of 200 mg l-theanine and 160 mg caffeine improved selective attention accuracy and cut reaction time more than placebo did. At everyday doses, 97 mg of l-theanine with 40 mg of caffeine improved task-switching accuracy and self-reported alertness, with no measurable effect on visual search or choice reaction time.
Other work in the same area found the pairing helped task switching while leaving subjective alertness unchanged. So the honest read for matcha caffeine vs coffee is that the combination measurably helps particular attention tasks. Claims about preventing crashes or extending energy across a fixed six to eight hour window do not have published measurement behind them, and a formulation team should not build a claim on them.
Antioxidant profiles and comprehensive health benefits
Any matcha vs coffee health benefits comparison usually reduces to catechins against chlorogenic acid, and the chemistry does not cooperate with that split. The same digestion study that measured matcha’s caffeine found chlorogenic acid to be the predominant phenolic in the matcha itself, at 2090 to 2460 micrograms per gram. Chlorogenic acid is not a coffee-only compound.
What does hold up is the delivery mechanism. Because you drink the ground leaf rather than a water extract, epigallocatechin and EGCG were among the best-released phenolics through digestion, with under 1% remaining in the residue. So the benefits of matcha vs coffee on the antioxidant side come from consuming the whole leaf, not from a compound coffee lacks.
The panel shows consumers reaching for wider health outcomes than either drink’s traditional claim. On coffee, wellness now reaches nearly 1 in 5 of the tracked functional signal (19.5%), ahead of straight energy. Anti-aging, hydration, and menopause all gained ground on coffee against a year earlier. When you look at coffee vs matcha health benefits through what people actually want, both drinks are being asked to do more than wake anyone up.
Metabolic velocity and weight management performance
Matcha vs coffee weight loss is one of the most searched angles on this comparison and one of the weakest on evidence, so it deserves plain numbers.
A meta-analysis of 15 randomized trials covering 1,243 people found that green tea catechins taken with caffeine produced statistically significant reductions in body weight, BMI, and waist circumference. The same authors described the clinical significance of those reductions as modest at best. A later dose-response analysis put the average reduction in body mass at 0.64 kg. A separate pooling of 11 trials found waist circumference down 1.37 cm and no significant effect on blood pressure.
Two details matter more than the headline. The effect tracks the catechin and caffeine combination rather than EGCG on its own, and the single trial that tested EGCG alone found no significant benefit. And the threshold is high. Published work puts the anti-obesity effect below prominence until intake reaches roughly 300 mg of EGCG a day, well above a standard two gram serving.
For an RTD team that is a dosing constraint, not a marketing angle. If your concept depends on a metabolic claim, you need the dose to support it or the claim to change.
Formulations, sensory profiles and cafe menu trends
Matcha runs earthy, vegetal, and faintly sweet, with an umami weight that milk and sugar soften. Coffee runs roasty and acidic, with bitterness that varies by roast and extraction. Those profiles decide which format each drink survives in, and the panel shows where matcha is heading.
The ingredients gaining ground alongside matcha are fruit-forward and format-driven rather than herbal. Dragon fruit, acai and green apple all sit in early lifecycle stages with rising movement. Tropical fruit sits there too, alongside tea bombs as a format. Gotu kola is the one botanical rising with them. The direction is lighter and brighter, which suits cold and iced builds far better than a traditional hot whisk.
Meanwhile the named functional actives are going the other way. L-theanine, ginseng and ashwagandha all sit in mature or declining stages. So do guarana, lions mane, magnesium and cordyceps. Consumers want the outcome and are drifting away from the compound name on the front of the pack. That is the single most useful line in this data for consumer marketing teams. Lead with clean energy or steady focus. Do not lead with the molecule.
You can see the same logic in the market. Starbucks built its matcha business on iced lattes rather than ceremonial preparation, Dunkin’ followed with its own matcha builds, and functional energy brands like Celsius and Alani Nu sell a benefit rather than an ingredient list. Starbucks Oleato showed how fast a cafe format can carry an unfamiliar ingredient when the drink itself reads familiar.
How Tastewise.io uses data-driven insights to predict beverage trends
Tastewise reads consumer signals, home preparation, and restaurant menus in the same window, which is why the matcha green tea vs coffee picture looks different here than in a quarterly category report.
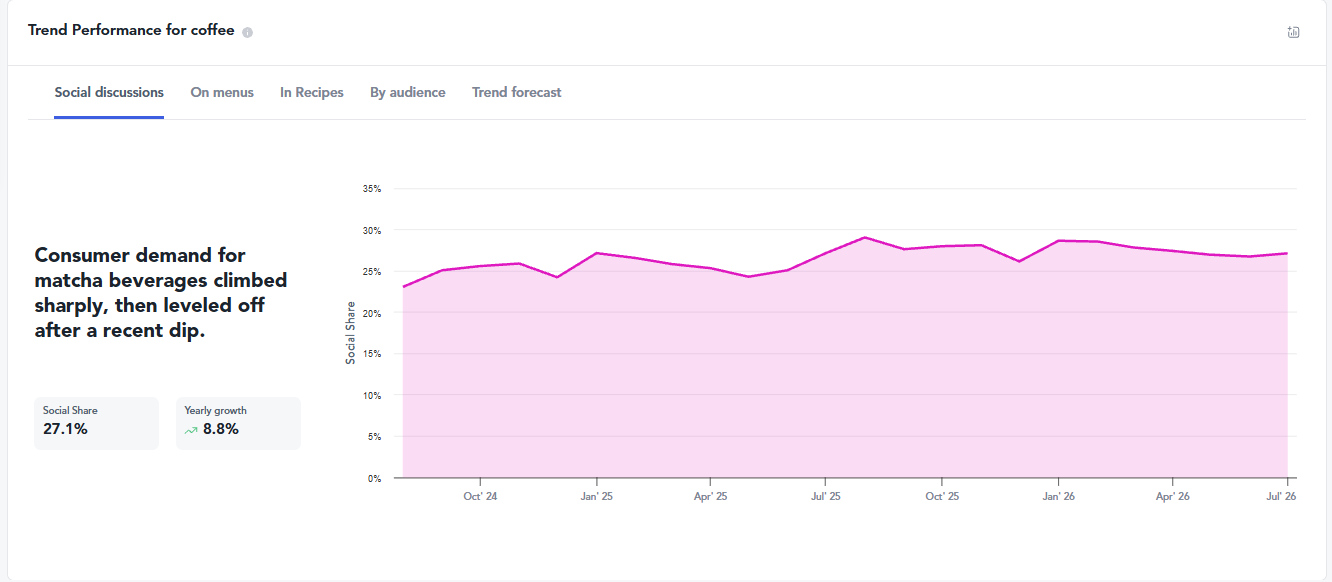
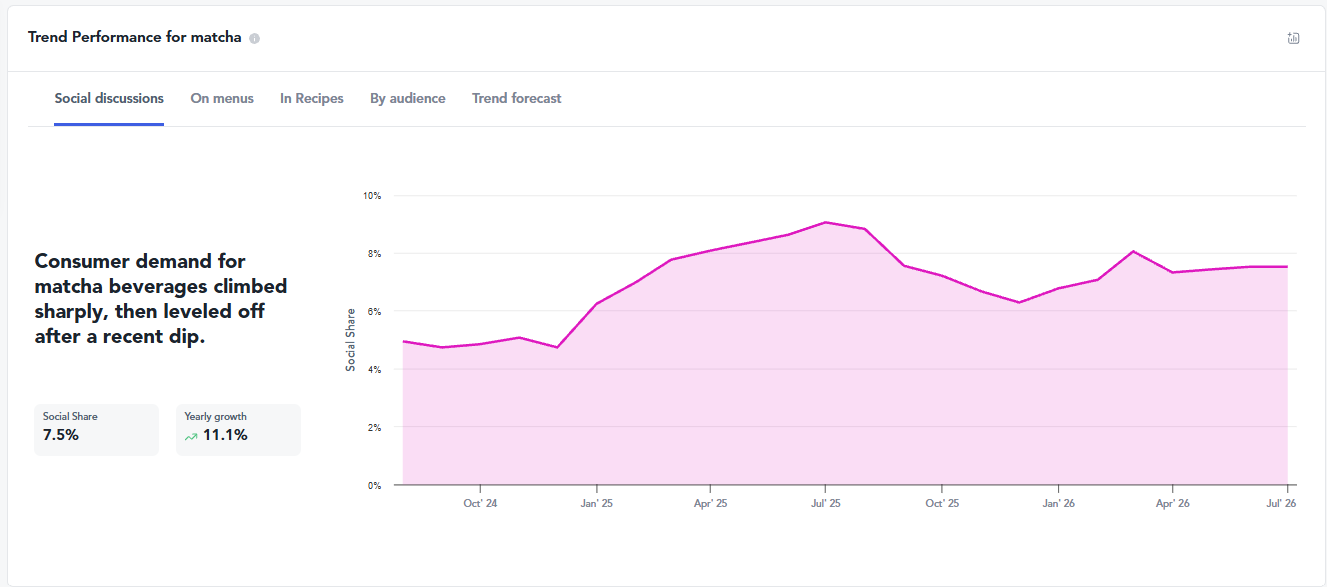
Across the panel, consumer interest in both drinks for energy and focus eased between September 2025 and July 2026, peaking in January and softening through summer. Menu presence moved the other way. Matcha’s menu index for that occasion climbed steadily and matcha grew about twice as fast as coffee did on the same measure. The forecast series for matcha reads the softer summer as a trough and points upward through mid 2027.
That gap between the two signals is the whole value of watching them together. Consumer signal leads, menus lag, and operators are still building out what people were asking for a year ago. A brand reading menus alone would conclude matcha is accelerating. A brand reading consumer signal alone would conclude it is cooling. Both are describing the same trend at different points in its travel.
Clean energy and nootropic demand
Clean energy is where matcha tea vs coffee competition is sharpest. It reaches nearly 1 in 7 of matcha’s tracked functional signal (15.4%) and nearly 1 in 5 of coffee’s (18.9%). It also over-indexes far harder in coffee. The clean-energy language is doing most of its work in the coffee aisle rather than the tea one.
The audience data sharpens it further. GLP-1 consumers index roughly twice as strongly on coffee for this occasion as they do on matcha, and protein prioritizers over-index on both. On-the-go snackers gained share on both drinks against last year. These are functional, convenience-led routines rather than ritual ones, which is a useful correction for anyone building consumer segments around matcha as a slow morning ceremony.
The counter-intuitive finding is on coffee. Calm is its fastest-rising motivation and it is climbing more than four times faster than calm on matcha. Coffee drinkers are asking coffee for the steadiness that matcha is famous for. That is a defensive problem for matcha brands and an open lane for coffee ones.
Foodservice adoption
On the operator side, matcha latte vs coffee is not a distribution fight anymore. Matcha appears on the beverage menu at 1 in 3 of the US chains that serve coffee and about 1 in 4 of the restaurants. Access is largely solved.
Depth is not. Matcha accounts for nearly 1 in 9 of those chains’ beverage menu items (11.6%) and nearly 1 in 10 of convenience-store beverage items (9.2%). In practice that means one matcha latte sitting beside a full coffee program. For teams working on menu planning, the whitespace is the second and third matcha SKU, not the first.
Real-world success: driving functional beverage growth through AI analytics
Take the decision a beverage brand actually faces when it has budget for one new RTD line and is weighing a matcha build against a coffee one. Coffee vs matcha at that table is a question about which risk you can retire with data.
Start with the occasion rather than the ingredient. The panel says matcha owns the energy and focus signal by a factor of three to four, so a matcha RTD enters a conversation that already exists. Coffee enters a much larger category where the fastest-growing motivation, calm, is one coffee has not historically owned. The first is a share fight in a small room. The second is a positioning fight in a large one.
Then set the claim before the formulation. Clean energy is growing on both and over-indexes on coffee, so a coffee RTD leading on steady focus is arguing with the grain of demand rather than against it. A matcha RTD leading on l-theanine by name is arguing against it, because that ingredient is in decline as a named callout even while its benefit grows.
Then check the dose against the claim. If the concept carries a metabolic benefit, the trial threshold above is the number to design to. If it cannot reach that dose in a drinkable format, the claim changes and the concept survives.
Finally, read the menu gap. Matcha’s thin menu depth at chains that already carry it is the clearest near-term opening in this comparison, and it favors a second format rather than a first listing. Teams that run this sequence with AI agents watching all three signals catch the divergence between consumer signal and menu adoption while there is still time to act on it.
Frequently asked questions about matcha vs coffee
Coffee has more caffeine per serving in most preparations. A published assay measured matcha at 16.1 mg of caffeine per gram, which puts a standard two gram serving near 32 mg.
Vendor figures of 30 to 35 mg per gram circulate widely and sit three to four times above that measurement, so treat published assays as the reference point for any formulation work.
Matcha delivers the whole leaf, so catechins including EGCG are consumed rather than left in the grounds, and digestion studies show those compounds release well. Coffee carries its own antioxidant profile and a much larger body of long-term population research.
Chlorogenic acid, often described as coffee’s signature compound, was the predominant phenolic in the matcha assay too, so the two drinks overlap more than the usual comparison suggests.
Neither produces a large effect. Pooled trial evidence found green tea catechins with caffeine reduced body weight by an average of 0.64 kg, and the authors of a 15-trial meta-analysis called the clinical significance modest at best.
The effect also depends on dose. Published work puts the threshold near 300 mg of EGCG a day, above what a standard serving provides.
Trial evidence supports a measurable attention benefit from l-theanine combined with caffeine, including improved task-switching accuracy at everyday doses. It does not support a specific crash-free duration.
Consumers clearly believe in the steadier lift, which is why energy reaches nearly 2 in 3 of the functional signal tracked around matcha beverages (63.8%).
The base matters less than the build. Sweetener and milk choice drive most of the nutritional difference between a matcha latte vs coffee latte at the same volume.
On the demand side, the fruit-forward ingredients rising alongside matcha, including dragon fruit and acai, point to lighter iced builds rather than heavier sweetened ones.
Not replacing, but closing distance. Matcha now appears at 1 in 3 of the US chains serving coffee, while accounting for nearly 1 in 9 of their beverage menu items (11.6%).
Matcha also shows up inside the coffee occasion itself and is growing faster there than in its home tea category, which is the clearest sign the two are converging rather than one displacing the other.

We’d love to learn your goals and see how Tastewise fits
We’d love to learn your goals and see how Tastewise fits
Get a personalized demo
Good taste. Wise move.
Your demo request is confirmed. We’ll reach out within one business day to schedule your walkthrough.
What happens next

See what’s driving demand, then turn it into a sell-in story for retailers and operators.
- Connect consumer panels, market trackers, and agents into one evidence view
- Get the “why” behind what’s changing, with explainable demand drivers
- Walk away with a buyer-ready narrative and next steps to activate
Trusted by





“Tastewise is my secret tool for knowing what consumers want next and why.“