





Most food and beverage concepts do not survive contact with the shelf. Only 25% of new brands and disruptive launches from large CPG companies are still on shelf four years later, according to McKinsey packaged-food analysis cited by FoodNavigator. That gap usually opens at the evaluation step, before formulation begins. Teams concept evaluate an idea against what people said in a survey rather than what they already eat and drink. This guide shows how to concept evaluate an idea against live consumption signals, using US data from the past 12 months.
Key takeaways
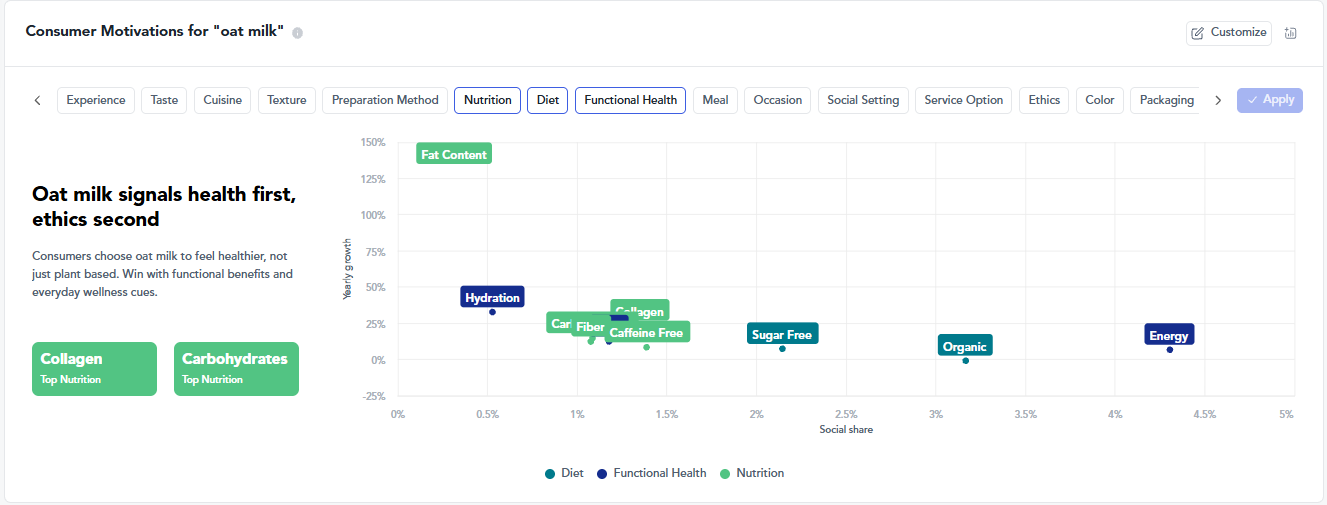
- Energy leads US beverage conversation at 4.2% share and rose 24% on the prior year, which makes it the strongest signal and the most contested one.
- Energy also dominates the shelf, appearing on 128 new beverage SKUs in the past 12 months at an average price of $8.28.
- Calm grew faster than energy in conversation, up 34%, yet it does not appear among the claims on new beverage launches at all.
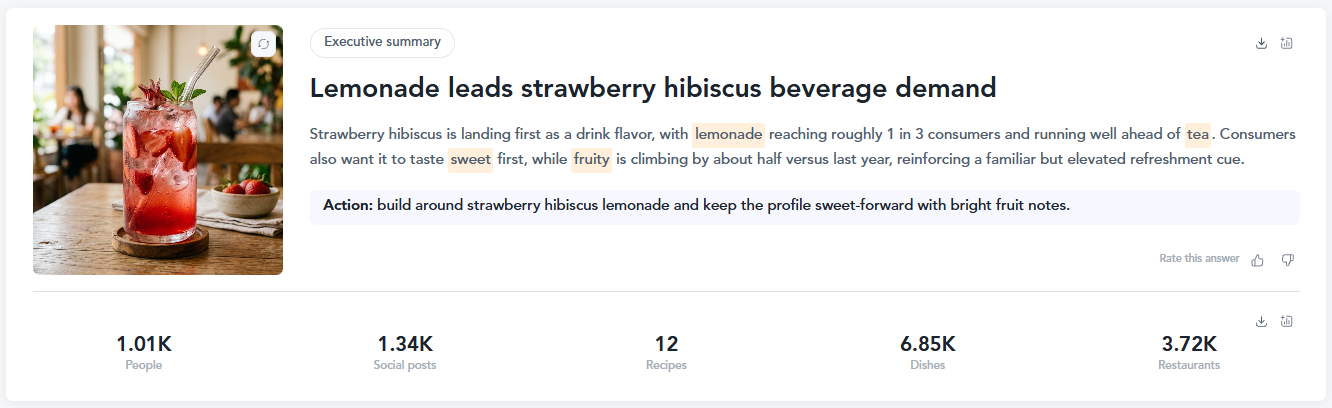
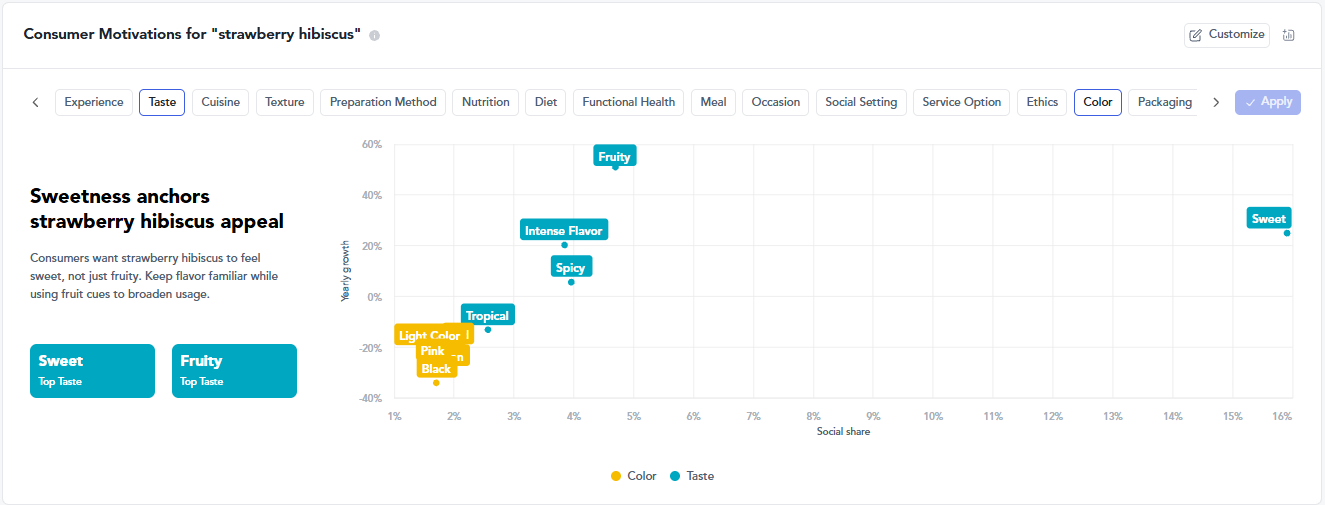
- Growth percentages alone will mislead you. Strawberry hibiscus rose 293% in beverage conversation and still holds 0.01% share.
- Matcha shows what durable adoption looks like, reaching 7.9% of US operator menus with menu presence up 13% against last year.
- Weight management fell 44% as a beverage motivation over the same period, so a concept anchored to that claim is launching into a receding need.
How can businesses evaluate new product concepts using AI?
Businesses evaluate new product concepts using AI by scoring an idea against observed behavior rather than stated intent. The inputs are social posts, restaurant menus, retail shelf data and recipes. Read together, they test a concept against what people already choose, where they choose it and what they pay for it.
That distinction is the whole value of an evaluate concept test. A focus group asks people to predict their own future behavior, which they do badly. Menu and shelf data record what operators and brands have already committed money to. Consumer signals record what people reach for without being asked. When the three agree, a concept has evidence behind it.
The shift from stated intent to real-time behavioral data
Behavioral data also tells you who the concept belongs to. Across US beverage conversation in the past 12 months, beer lovers appear 1.88 times more often than the market average and coffee lovers 1.85 times. Dunkin customers account for 6.6% of that conversation. Those are routines, not demographics, and they point to occasion and format before they point to age brackets. Defining consumer segments this way changes the test itself, because a concept aimed at a morning coffee routine is judged on different criteria than one aimed at an evening wind-down.
Deconstructing the modern proof of concept
Knowing how to evaluate a proof of concept starts with ingredient velocity, and velocity has stages. In US beverage data, chickpea protein sits at the early stage with growth of 126%. Strawberry hibiscus has moved to emerging at 293% growth. Matcha is trending at 1.39% share. Collagen has matured and fell 12%, magnesium fell 21%, and ginger is declining at a 15% drop.
Each stage carries a different risk. Early ingredients offer white space and no proof of repeat behavior. Mature ones offer proof and thin margin for differentiation. Declining ones look safe in a deck because they are familiar. Reading stage before size is the part most concept reviews skip, and it is where AI for CPG teams changes the answer.
What are the most effective methods for AI concept testing?
The most effective methods for AI concept testing read the same idea three ways: what consumers reach for, what operators put on menus, and what brands ship to shelf. A concept that clears all three has crossed from interest into behavior, and the places where the three disagree are usually the commercial opportunity.
Energy and calm show how that works. Energy holds 4.17% of US beverage conversation and grew 24%. Calm holds 0.91% and grew 34%. On shelf the picture inverts. Energy claims appear on 128 new SKUs across 4,778 products, while the nearest functional claims are far smaller, with brain function on seven launches and metabolism on eight. Calm does not register.
So the crowded claim is the loud one, and the fastest-moving consumer need has almost no packaged competition. That is a concept evaluation finding a survey panel cannot produce, because it requires the consumer side and the shelf side in the same frame.
Balancing speed with methodological depth
Teams that evaluate the future concept pipeline on growth rates alone will keep buying spikes. Strawberry hibiscus grew 293% and holds 0.01% of beverage conversation, which is a rounding error dressed as a trend. Matcha grew 8% on a 1.39% share, which is a far smaller number attached to a far larger base.
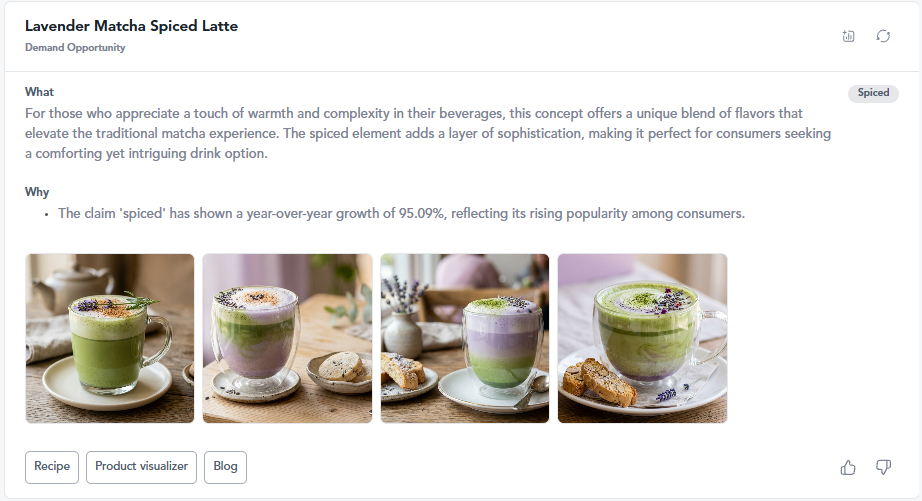
Menu data settles the argument. Matcha now appears on 7.9% of US operator menus, up 13% against the prior year, while its consumer conversation share rose 32%. It has also left the specialty tea shop. Caribou Coffee lists a lavender matcha tea latte at $6.47, Wawa sells a matcha cream at $6.09, and The Cheesecake Factory added a matcha latte at $6.95. When a flavor reaches convenience retail and casual dining at the same time, the trend has become infrastructure. The foodservice forecast tracks where that spread goes next.
Integrating qualitative context into quantitative scores
Adoption and pricing power are separate questions, and concept scoring should keep them apart. The average US menu price for a matcha item is $7.93 and it has been flat for two years, drifting down slightly. Over the same period the number of matcha items per operator climbed to 5.7. Operators are building depth into the flavor without charging more for it.
For a concept team, that reads as a warning about margin assumptions. A matcha launch priced on novelty is arriving after the novelty window closed. A matcha launch priced on function, format or occasion still has room. This is how to evaluate a concept properly, by asking what the data allows you to charge, not only whether people want it. Platforms built for food innovation analysis should surface both sides.
A botanical energy concept, evaluated
Take a botanical energy drink concept aimed at afternoon focus. The evaluation returns four findings. Energy is the right need at 4.17% share and 24% growth. Energy is also the wrong entry point on price, because 128 competing launches sit at an average of $8.28. Calm is the underserved adjacent need at 34% growth and no shelf presence. Matcha is the ingredient that already carries both meanings, with proven menu adoption at 7.9% and flat pricing.
The concept survives, but it changes. Rather than a botanical energy drink competing on stimulant claims, the evidence points to a matcha-based focus drink positioned between energy and calm, priced against the $6.09 to $6.95 range where the flavor already sells. That is a formulation decision, a pricing decision and a positioning decision, taken before a single batch is produced.
How does customized testing improve product development outcomes?
Customized testing improves outcomes because a concept does not perform in the abstract. It performs in a channel, a region and a routine. Testing parameters that match the intended distribution produce a score you can act on. Generic parameters produce a score that flatters every idea equally.
Tailoring testing models to channel and brand strategy
Channel changes the verdict. Beverage conversation linked to convenience shoppers is moving quickly, with am/pm up 84%, Lidl up 69% and Circle K up 66% over the past 12 months. A concept destined for convenience should be evaluated against those signals rather than against the national average, because the pack size, price point and occasion are all different. The same concept judged for grocery retail sell-in needs shelf-claim evidence instead.
Continuous concept iteration versus one-time testing
A single test is a photograph of a moving market. Energy as a beverage motivation peaked at 4.80% share in January 2026 and had fallen to 3.40% by August. A concept validated in January against that peak would have been scored against a number that stopped describing the market before it reached production.
Running the same evaluation monthly catches that drift. It also catches the reverse case, where a claim you rejected has started to build. Teams running always-on intelligence treat concept evaluation as a tracker rather than a gate.
Seven questions to ask before you run a concept test
- What is the universe this concept competes in, and what share does the lead ingredient hold inside it?
- Which lifecycle stage does the lead ingredient sit in, and does the launch timeline match that stage?
- What is the growth rate attached to, a large base or a rounding error?
- Has the signal appeared on restaurant menus, and at what share of operators?
- What claims already sit on competing packs, and how many launched in the past year?
- What has the average price done while adoption rose, and what does that allow you to charge?
- Which routines and channels over-index on this concept, and does the format match them?
Putting concept evaluation to work
The teams that get this right test against better evidence, then re-test while the market moves underneath them. Every number in this article came from a live read of US consumer, menu and shelf data over 12 months, and every one of them will look different next quarter.
Frequently asked questions about concept evaluation
The most effective methods combine consumer signals, restaurant menu adoption and retail shelf data in a single evaluation. Energy shows why, holding 4.17% of US beverage conversation while appearing on 128 new SKUs, which tells you the need is real and the entry is crowded.
Businesses score concepts against observed behavior instead of stated intent, using social, menu, recipe and shelf data. This surfaces gaps a survey misses, such as calm growing 34% among beverage consumers with no meaningful presence on new packaged launches.
Ask what the concept’s share is inside a defined category, what lifecycle stage its lead ingredient sits in, and whether the signal has reached menus. Matcha on 7.9% of US operator menus is a different kind of evidence than a 293% growth rate on a 0.01% share.
Quinoa tends to hold better per calorie, with double the fiber, more protein and a glycemic index of 53 against 65 for couscous. Couscous is lighter per gram, so it works when portions are controlled.
Matching test parameters to channel, region and routine produces a decision you can act on. Convenience-linked beverage signals grew up to 84% over the past year, so a convenience concept judged against national averages is judged against the wrong benchmark.
Check ingredient velocity, need state and pricing headroom together. Matcha menu presence rose 13% while average menu price stayed near $7.93, so adoption and pricing power are moving in different directions and a concept should be priced accordingly.



We’d love to learn your goals and see how Tastewise fits
We’d love to learn your goals and see how Tastewise fits
Get a personalized demo
Good taste. Wise move.
Your demo request is confirmed. We’ll reach out within one business day to schedule your walkthrough.
What happens next

See what’s driving demand, then turn it into a sell-in story for retailers and operators.
- Connect consumer panels, market trackers, and agents into one evidence view
- Get the “why” behind what’s changing, with explainable demand drivers
- Walk away with a buyer-ready narrative and next steps to activate
Trusted by





“Tastewise is my secret tool for knowing what consumers want next and why.“