







Protein has topped the list of nutrients Americans say they are trying to eat more of for five straight years, reaching 7 in 10 consumers in the 2025 IFIC Food and Health Survey. That demand has pushed two tubs to the front of the dairy case. The cottage cheese vs greek yogurt question now shows up in category reviews, formulation meetings and retail buyer decks. This article compares both on protein, macros, sodium and texture, then reads the live US demand behind each one.
Key takeaways
- Cottage cheese carries more protein per gram. USDA lists lowfat 1% cottage cheese at 12.4g per 100g against 10.2g for plain nonfat Greek yogurt.
- Sodium is the real separator. Cottage cheese runs roughly 11 times the sodium of nonfat Greek yogurt, at 406mg per 100g against 36mg.
- Both products are casein-dominant, so the fast-versus-slow protein framing that surrounds this comparison does not separate them.
- Greek yogurt appears on 3.7% of US restaurant menus against 2.1% for cottage cheese, and its menu presence rose 14.4% over the past year while cottage cheese moved 0.5%.
- Greek yogurt sits in 16 retail sales categories against 3 for cottage cheese, with 19 new SKUs in the window against 3.
- A protein claim already appears on nearly 1 in 2 cottage cheese SKUs (47%) yet led only one new launch, while low fat claims led two.
What is the difference between cottage cheese and Greek yogurt?
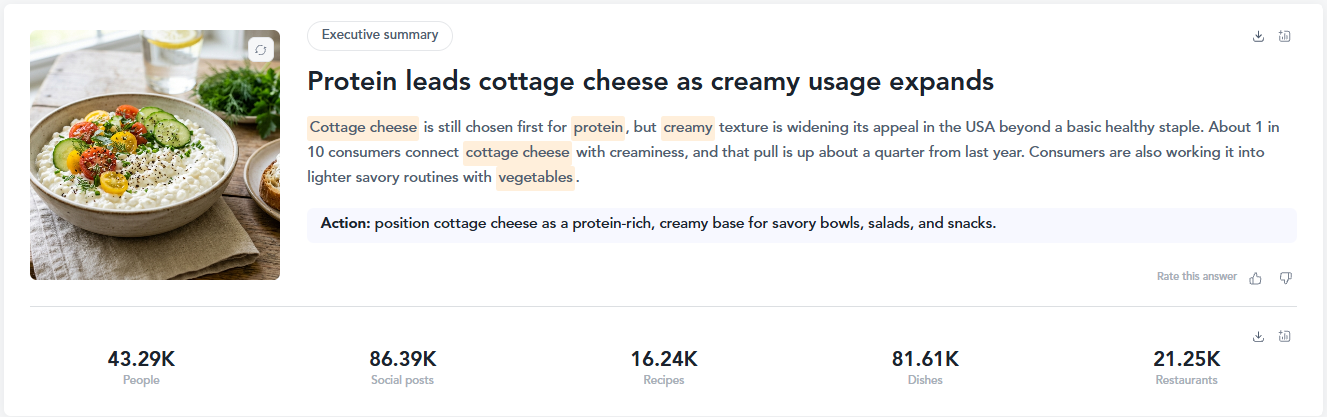
Cottage cheese is drained acid-coagulated curd, sold as loose curds held in a cream or milk dressing. Greek yogurt is cultured milk strained to remove liquid whey, which leaves a smooth, thick and acidic base. Both are high-protein cultured dairy products built on casein.
Protein concentration and amino acid profiles
Run the cottage cheese vs greek yogurt protein comparison on a fixed weight and cottage cheese wins narrowly. USDA FoodData Central lists lowfat 1% cottage cheese at 12.4g of protein per 100g and plain nonfat Greek yogurt at 10.2g. Measured per calorie instead, the two are effectively level, because cottage cheese carries the extra calories of its cream dressing. Anyone comparing protein in cottage cheese vs greek yogurt at the tub is arguing over about two grams.
The digestion story is where this comparison usually goes wrong. Milk protein is roughly 80% casein and 20% whey. Straining Greek yogurt removes the soluble whey along with the liquid, which raises the casein share rather than lowering it. Cottage cheese curd is casein for the same reason. So greek yogurt vs cottage cheese is not a fast protein against a slow one, and copy that claims otherwise will not survive a technical review.
The underlying research is real, but it describes isolated proteins rather than these two tubs. In the PNAS study that established the distinction, casein inhibited whole-body protein breakdown by 34% while whey did not, and whey raised postprandial protein synthesis by 68% against 31% for casein. That contrast belongs in a shaker, not in a cottage cheese protein vs greek yogurt claim on pack.
Audience data separates them more usefully. Across the Tastewise US consumer panel, keto consumers lead interest in Greek yogurt, ahead of vegan consumers and beer lovers. Vegetarians lead on cottage cheese, with chefs in second place. That chef presence matters, because it points to professional kitchens testing the ingredient before operators menu it.
Macronutrient profiles and caloric breakdown
On cottage cheese vs greek yogurt macros, the sodium line does more work than the protein line. USDA puts lowfat 1% cottage cheese at 406mg of sodium per 100g and plain nonfat Greek yogurt at 36mg. That is roughly an eleven-fold gap, and it comes from the salting step in cottage cheese manufacture rather than from the milk. Greek yogurt also carries close to twice the calcium, at 110mg per 100g against 61mg.
Calories follow fat level in both. USDA lists plain nonfat Greek yogurt at 61 calories per 100g, and lowfat cottage cheese sits above it once the dressing is counted. For teams working cottage cheese vs greek yogurt calories into a pack claim, the honest read is that a nonfat Greek yogurt is the leaner base and a lowfat cottage cheese is the higher-protein one.
Shelf data shows the industry has not settled on which of those to lead with. On US e-commerce shelves, low fat and fat content claims each led cottage cheese launches with two new SKUs apiece, while protein led just one. Protein already appears on 177 of the 376 cottage cheese products listed, so the claim is widely stocked and thinly launched. Greek yogurt launches went the other way and leaned on origin, with greek, mediterranean and icelandic claims each carrying 16 new SKUs, protein at seven and fat free at four.
Price sits with cottage cheese. It averages $3.66 against $3.16 for Greek yogurt across the tracked US shelf, a premium of roughly 16% per unit despite a narrower assortment.
Production methods and digestive dynamics
The two products diverge at coagulation. Cottage cheese is set with acid and sometimes with rennet. The curd is then cut, cooked and drained before it is dressed with cream and salt. Greek yogurt is fermented with thermophilic lactic acid cultures, then strained to pull off acid whey, and the live cultures remain in the finished product.
Those routes create the formulation constraints teams actually hit. Greek yogurt brings an acid load that works in marinades and breaks under high heat. Cottage cheese brings curd structure that binds in a batter and survives a bake, along with the sodium that came in with the salt. When you compare greek yogurt vs cottage cheese nutrition for a reformulation, those two facts usually decide the answer before the protein numbers do.
Culinary application and textural versatility
Consumer format data shows two very different pictures. Cottage cheese concentrates in familiar breakfast formats. Toast leads its format mix at 8.7%, followed by cake at 8.5% and egg white at 7.2%. Smoothie and pancake both sit at 6.3%. All five are mature formats and all five softened over the past year, with toast down 10.5% and smoothie down 16.9%.
Greek yogurt shows movement instead. Salad still leads its mix at 13.0% but fell 15.5%. Cake rose 8.9% to reach 11.6% of its mix. Cookie rose 22.8% to 5.2%. The platform classes both as trending, while cereal and smoothie declined. The growth in Greek yogurt is in baked applications, not in the wellness formats that built the category.
Read together, the two sets point the same way. Cottage cheese has rising demand sitting on a set of declining formats, which is a format development problem rather than a demand problem. Texture is the obstacle to design around, and the shelf reflects it: texture claims appear on 160 cottage cheese SKUs and creamy claims on 153, ahead of most nutrition claims.
The market is already moving on this. Arla brought a cottage cheese range to UK retail positioned for toast, bakes and sauces rather than for dieting. Good Culture puts category growth at almost 60% over three years and opened a dedicated production facility with the Michigan Milk Producers Association to keep up. Our earlier read on cottage cheese trends covers the shelf assortment gap in more detail, and the wider dairy trends picture sets both products against cheese and milk.
How Tastewise uses data-driven insights to predict high-protein dairy trends
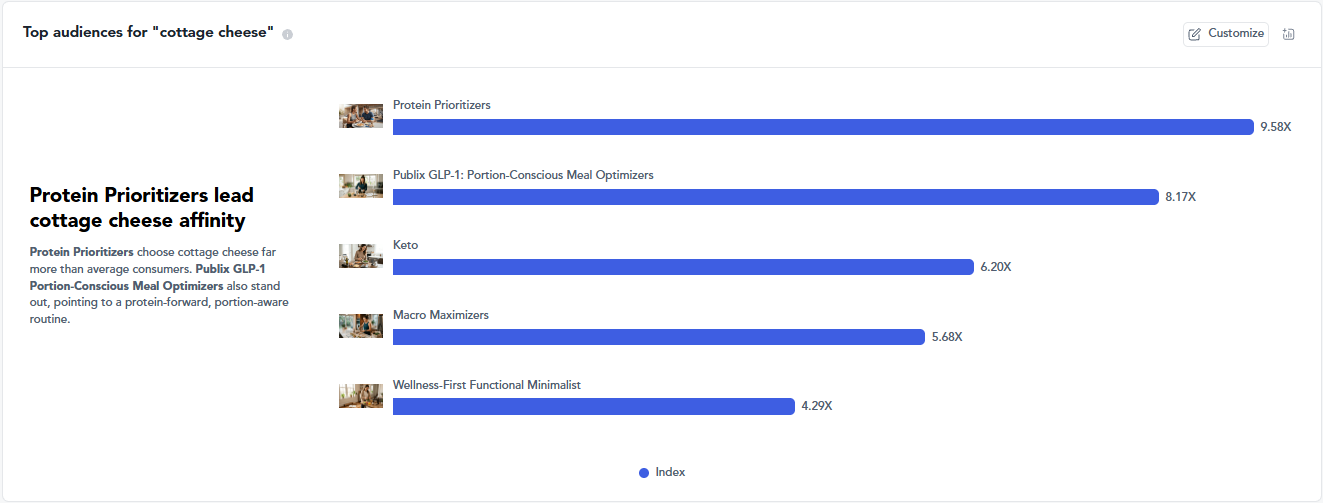
Tastewise reads consumer behavior, home recipe activity and restaurant menu listings on the same clock, so a protein shift shows up on shelves and menus in the same week rather than in a quarterly readout.
Satiety and macro tracking demands
IFIC found that 8 in 10 Americans are unaware or unsure how much protein they should eat in a day. That single finding reframes the cottage cheese vs greek yogurt macros conversation for packaging. Most shoppers are not checking a gram target, so the claim on the front of pack is doing the persuading, and the audience split decides which claim to use. Keto over-indexing on Greek yogurt argues for a macro-led front of pack, while the vegetarian and chef skew on cottage cheese argues for a versatility-led one. Our health and nutrition trends analysis tracks how those claim preferences are shifting, and the snack trends data shows where protein-forward formats are converting.
Foodservice and product innovation
The channel split is the sharpest finding in this comparison. Greek yogurt reaches 3.7% of US restaurant menus and grew that presence 14.4% across the last 12 months. Cottage cheese reaches 2.1% and grew 0.5%. Measured on the same operator universe and the same window, Greek yogurt is outpacing cottage cheese on menus by a wide margin, and it is doing so from a larger base.
Home cooking runs the other way. Cottage cheese recipe presence rose 2.6% while Greek yogurt recipe presence slipped 0.3%, and Greek yogurt still holds a far larger recipe footprint at 2.4% against 0.35%. Cottage cheese is currently a home behavior with an operator gap, and the platform forecast has its demand continuing to climb into next year while Greek yogurt holds steady. That gap between rising home use and flat menu presence is the whitespace, and it is the kind of signal that product innovation teams and retail sell-in teams can both act on.
Real-world success: driving CPG growth through AI analytics
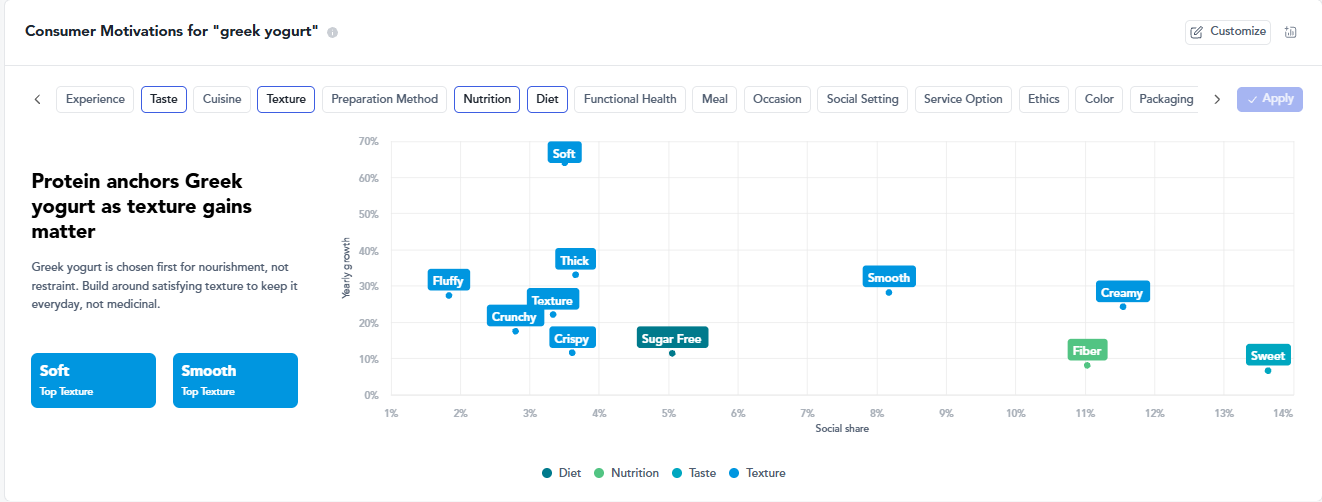
Dairy teams use Tastewise to settle base-selection questions with demand evidence rather than category intuition, then carry the same evidence into buyer and operator conversations. Here is how that runs on a live decision, using the numbers above.
Start with reach and velocity together. If you are launching a protein bowl or an RTD line this year, Greek yogurt is the defend-and-extend base, because it reaches more menus and five times more retail categories today. Cottage cheese is the build-ahead base, because its reach is smaller but its forecast is rising while Greek yogurt holds flat.
Then check format. A bowl built on cottage cheese cannot lean on toast, pancake or smoothie, since all three are losing ground. Savory blended applications and high-protein baked formats are where the movement actually sits, and neither is crowded.
Then check the physical constraint. For a hot-fill RTD, cottage cheese brings 406mg of sodium per 100g and a curd that has to be broken down, which is a process cost before it is a marketing one. Greek yogurt brings heat sensitivity and acidity in the same slot.
Then set the claim. Protein is under-launched on cottage cheese and over-supplied on the existing shelf, so a new cottage cheese SKU that leads on protein alone lands in a crowd of 177 products. Greek yogurt launches are competing on origin, which leaves a functional claim more open there than the raw counts suggest.
Finally, benchmark against who is already moving. Daisy holds broad distribution in cottage cheese and Good Culture holds the clean-label position, while Chobani, Fage, Oikos and Siggi’s anchor Greek yogurt. Any concept has to beat those positions on a specific occasion, not on protein content in general.
Frequently asked questions about cottage cheese vs greek yogurt
Cottage cheese, by a narrow margin. USDA lists lowfat 1% cottage cheese at 12.4g of protein per 100g against 10.2g for plain nonfat Greek yogurt, and the two are close to level per calorie.
Greek yogurt is the leaner base and carries far less sodium, at 36mg per 100g against 406mg for cottage cheese. Cottage cheese gives you slightly more protein per gram and close to twice the calories at typical retail fat levels.
At standard retail fat levels, yes. USDA puts plain nonfat Greek yogurt at 61 calories per 100g, and lowfat cottage cheese sits above that once its cream dressing is counted.
No, both are casein-dominant. Milk protein is roughly 80% casein, and straining Greek yogurt removes soluble whey, which pushes the casein share higher rather than lower.
On restaurant menus, Greek yogurt. Its menu presence rose 14.4% over the past year against 0.5% for cottage cheese, though cottage cheese is the one gaining in home recipes at 2.6%.
It depends on the channel you are launching into. Greek yogurt has wider presence today across 16 retail categories and 3.7% of menus, while cottage cheese has fewer competing SKUs, a 16% price premium and a rising demand forecast.




We’d love to learn your goals and see how Tastewise fits
We’d love to learn your goals and see how Tastewise fits
Get a personalized demo
Good taste. Wise move.
Your demo request is confirmed. We’ll reach out within one business day to schedule your walkthrough.
What happens next

See what’s driving demand, then turn it into a sell-in story for retailers and operators.
- Connect consumer panels, market trackers, and agents into one evidence view
- Get the “why” behind what’s changing, with explainable demand drivers
- Walk away with a buyer-ready narrative and next steps to activate
Trusted by





“Tastewise is my secret tool for knowing what consumers want next and why.“