





Trade promotion is the second largest line on most food and beverage P&Ls, and it is the one nobody can fully account for. Consumer packaged goods companies worldwide put roughly 20 percent of annual revenue into trade promotions, and 59 percent of those promotions lost money, rising to 72 percent in the United States. That gap is what trade promotion optimization exists to close.
The reason the money leaks is rarely the discount itself. It is that the plan was built on last year’s calendar and a static price assumption, then measured after the event closed. Legacy enterprise setups, including a standard SAP trade promotion optimization deployment, are good at recording what you committed. They are weaker at telling you what consumers will actually want in week three of the promotion. AI trade promotion optimization adds that missing input, turning point-of-sale history and live consumer demand signals into a promotion you can defend before you fund it.
Key takeaways
- Trade promotion optimization is the analytical process of modeling, forecasting and executing retail promotions for net profit, rather than tracking budgets after the fact.
- Trade promotion management records claims, budgets and execution. Trade promotion optimization analytics predicts baseline volume, price elasticity and incremental margin before the event runs.
- The process runs in five stages, from data aggregation and baseline estimation through predictive modeling, execution and a post-event ROI audit.
- Consumer demand shifts inside a single quarter. In the Tastewise US consumer panel, energy claims carry 4.2% of beverage conversation and grew almost 30% over the past year, while calm claims grew 44% from a much smaller base.
- Claim demand also moves by month, so the same promotion mechanic can work in January and fail in July.
- Machine learning models improve every cycle because they keep the cannibalization and pantry-loading effects that spreadsheet models drop.
What is trade promotion optimization and how does it work?
Trade promotion optimization is the data science process CPG manufacturers use to model, forecast and execute retail promotions that maximize revenue, volume and net profit. A working trade promotion optimization definition has three parts: you predict the baseline you would have sold anyway, you predict the lift a given mechanic will add, and you price the whole event against its true cost.
That is the shift the term describes. What is trade promotion optimization in practice is the move from budget tracking to algorithmic prediction, where every promotion has a modeled outcome attached to it before the funds are committed.
Trade promotion management vs. optimization
The two get used interchangeably and they do different jobs.
Trade promotion management optimization, in its legacy sense, is a system of record. It holds the promotional calendar, the account-level budget, the deduction and claim reconciliation, and the execution schedule. It answers what you agreed to and what you paid.
Trade promotion optimization analytics is a system of prediction. It estimates the baseline volume you would have sold at full price, models price elasticity by SKU and account, and calculates what the event contributed after cannibalization. It answers whether the promotion was worth running and what to run next time. Most brands need both. The failure mode is owning only the first one and calling it optimization.
The 5-step trade promotion optimization process
A complete trade promotion optimization process runs in five stages.
- Data aggregation. Pull point-of-sale data, syndicated retail measurement, shipment and deduction records, and external consumer demand signals such as flavor and dietary trends. The consumer layer is the one most brands skip.
- Baseline sales estimation. Model what each SKU would have sold at full price in each account and week. Every ROI number downstream depends on this being right.
- Predictive modeling and scenario testing. Run every mechanic you are considering against the baseline and compare modeled net profit. That means a temporary price reduction at several depths, a display and a multi-buy, each priced separately.
- Execution and automated trade promotion optimization. Push the chosen plan to accounts, then let the model adjust recommendations as actual scan data arrives mid-flight.
- Post-event analysis and ROI audit. Decompose the result into baseline, incremental volume, cannibalized volume and forward-buy, then feed the finding back into the model.
Stage five is where most programs stop short. An audit that produces a number but never returns to the model leaves you repeating the same plan next year with better documentation.
Consumer timing is the input that makes stages one and three worth running. The LTO calendar for 2026 maps the seasonal and cultural moments that move food and beverage demand month by month, which is the layer a promotion calendar should be built against.
How do AI algorithms and machine learning power trade promotion optimization software?
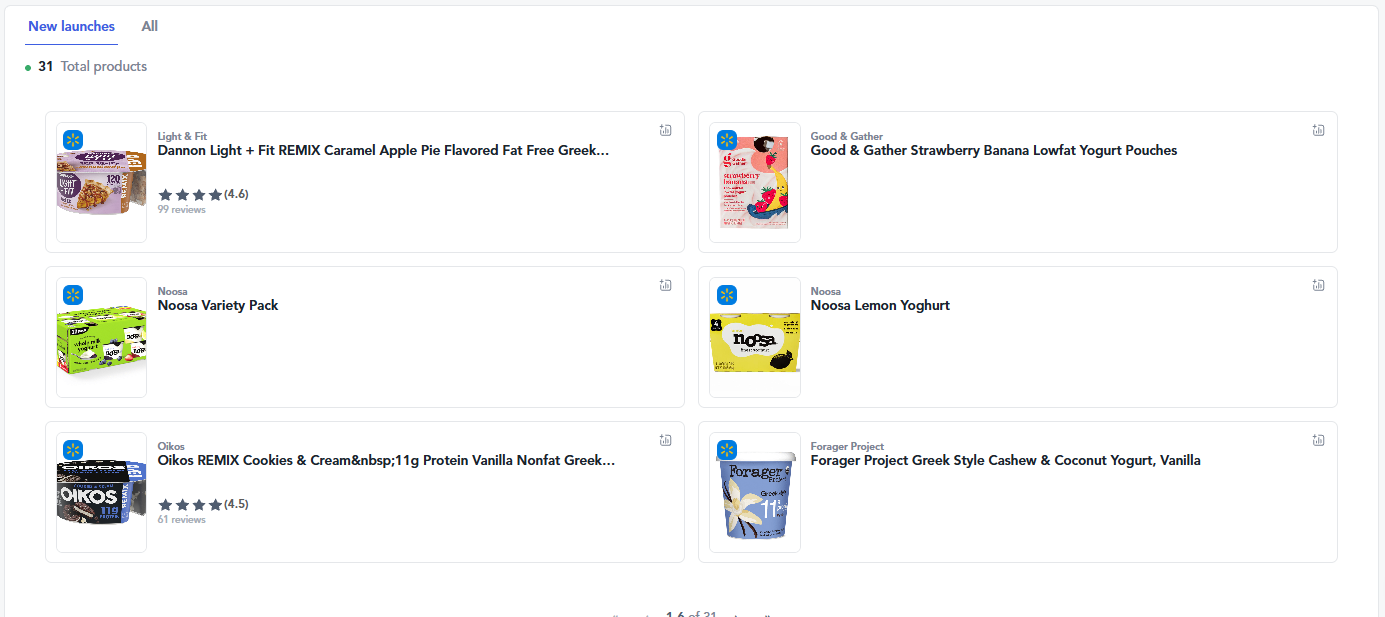
Trade promotion optimization algorithms read historical promotion mechanics against outcomes. They look at temporary price reductions by depth, end-cap and off-shelf display, BOGO and multi-buy structures, feature ads and account-level compliance. Each one is then scored on how it performed once the baseline was removed. The output is an elasticity curve per SKU and account rather than a single rule of thumb.
Trade promotion optimization machine learning goes further by refreshing those elasticities as behavior changes. It accounts for switching between your SKUs and competitors, seasonal diet shifts, category cross-elasticity and forward-buying by shoppers who stockpile at a deep discount. McKinsey’s analysis of CPG promotion effectiveness makes the point that lift and ROI figures calculated without cannibalization and pantry loading can destroy value while appearing to succeed.
What most trade promotion optimization tools cannot see is why demand is moving. Transactional data records the purchase after the fact. Tastewise adds the demand side, meaning what people are actively looking for, cooking and ordering. That gives the model a forward-looking input alongside the backward-looking one. That is the same signal set behind promotional planning for brands working the retail shelf.
The claim you promote matters more than the depth you discount
Across the Tastewise US consumer panel, energy is the leading functional claim in beverage, holding 4.2% of category conversation and growing close to 30% against the previous year. Calm is much smaller at 0.9% but grew over 44%, the fastest of any claim in the set. Wellness grew modestly at 3.5%.
Several claims are moving the other way. Healthy fell almost 22%, mental health dropped nearly 25%, organic fell around 18% and gut health declined close to 16%. That matters commercially. Funding a deep discount behind a gut health message right now means paying to promote a claim that is losing consumer attention, which no amount of price elasticity modeling will rescue.
Ingredients tell a similar story. Chickpea protein grew nearly 45% over the past year and coconut creamer 36%, both from an early base. Collagen creamer grew almost 28%. Matcha sits at 1.27% of beverage conversation and grew 10.5%, which makes it the established option rather than the emerging one. A promotion built on matcha is defending a position. A promotion built on chickpea protein is buying a position, and those two events should not be modeled with the same volume assumption.
CPG scenario: a functional beverage promotion, re-planned
Take a functional beverage brand planning a July promotion with a national grocery account. The default plan is the one that worked last winter: a 30% temporary price reduction on the energy SKU, no display support, funded from the summer trade budget.
An ai-driven trade promotion optimization platform models it differently, because the consumer signal is not flat across the year. In the panel data, energy conversation peaked in January at 4.8% of beverage discussion and fell steadily to 3.4% by July. Hydration ran the opposite way, sitting at 0.84% in April and May before climbing to 1.11% in July, its high for the period. Calm followed energy down, from 1.36% in January to 0.61% in July.
So the July plan is aimed at a claim in seasonal decline. The model recommends two changes. Lead the July event on the hydration SKU rather than the energy one, and take the discount to 15% with off-shelf display support instead of 30% with no display. A shallower cut against rising demand, with visibility, forecasts more incremental revenue than a deep cut against falling demand. The 30% energy event moves to January, where the signal is strongest and the same discount buys more volume.
This is the difference between an ai trade promotion optimization solution and a spreadsheet. The spreadsheet knows what the SKU did last July. It does not know that the reason to promote it has shifted three points of category attention since then. Brands running consumer marketing and trade planning off the same demand data stop making that mistake twice.
Evaluating trade promotion tools: legacy systems vs. modern AI software
Brands working through a market guide for trade promotion management and optimization tend to arrive at the same conclusion. The enterprise deployments are thorough and slow, the implementation depends heavily on trade promotion optimization consulting, and by the time the system is live the promotional environment has moved. The pivot is toward agile trade promotion optimization software that integrates with the data a brand already has.
Feature comparison matrix
| Feature dimension | Traditional / legacy TPM solutions | Modern AI trade promotion optimization software |
|---|---|---|
| Data inputs | Historical POS and ERP accounting data | Real-time POS, web search, social sentiment and consumption trends |
| Forecasting method | Static regression models and manual spreadsheets | Continuous trade promotion optimization machine learning models |
| Optimization capabilities | Basic post-event reporting | Predictive scenario modeling and automated trade promotion optimization |
| Implementation and agility | Heavy reliance on trade promotion optimization consulting | Fast deployment with direct platform integrations |
When comparing trade promotion optimization companies, the useful question is not which has the longest feature list. It is which one can tell you why a promotion will work in the month you plan to run it. A trade promotion optimization model that only reads your own transaction history will always be describing the past.
Core benefits for food and beverage brands
The benefits of trade promotion optimization show up in four places.
Promotion slippage falls, because funds stop going to events the model has already flagged as unprofitable. Margins improve, since discount depth gets matched to measured elasticity rather than set by precedent or by what the account asked for. Retailer conversations get easier, because you arrive with a modeled forecast and a demand rationale instead of a proposed discount, which is the same footing that works for retail sell-in. And cannibalization stops being invisible, so a promotion that lifts one SKU by pulling volume from another gets counted honestly.
For food and beverage specifically there is a fifth. Claim and flavor demand in this category turns over faster than in most CPG segments, as the swing between energy and hydration inside two quarters shows. A promotion plan set once a year cannot track that. This is where AI agents running continuously against live demand data change what a trade calendar can respond to.
Getting started does not require replacing your TPM system. Most brands begin by adding a demand layer to the planning stage, testing the model against two or three accounts for a quarter, then widening it once the baseline estimates prove out. A custom report on your own category is a reasonable first look at what that layer contains. The same demand data supports the broader CPG sales motion, and the seasonal patterns behind limited time offer food trends apply directly to promotional timing.
Trade promotion will keep taking a fifth of revenue. Whether it returns anything depends on whether the plan is built on what consumers wanted last year or what they want next quarter.
Frequently asked questions about trade promotion optimization
Trade promotion optimization is the analytical process CPG manufacturers use to model, forecast and execute retail promotions for maximum net profit. It replaces post-event budget tracking with prediction, estimating baseline volume, price elasticity and incremental margin before the promotion is funded. The commercial case for it is direct, given that 72% of US trade promotions lose money.
Trade promotion management is a system of record that holds budgets, claims, deductions and execution schedules. Trade promotion optimization is a system of prediction that models baseline volume, elasticity and net profitability before an event runs. Most brands run both, and the common error is owning only the management layer.
Trade promotion optimization software aggregates point-of-sale, syndicated and consumer demand data, then models promotional scenarios against a predicted baseline to forecast net profit per mechanic. Modern platforms also adjust recommendations mid-flight as scan data arrives, which is the automated trade promotion optimization layer.
The algorithms compare historical promotion mechanics against outcomes with the baseline removed, producing an elasticity curve per SKU and account. Depth of discount, display type and multi-buy structure are each scored separately. Machine learning models then refresh those curves as behavior shifts, which matters in a category where a claim like calm can grow 44% in a year.
The main benefits are reduced promotion slippage, higher net margins, stronger retailer alignment and visibility into cannibalization. Food and beverage brands gain a fifth benefit from demand timing, since claim interest moves within a single quarter. Fitness claims declined around 6% over the past year while wellness grew 3.5%, so two adjacent positionings can need opposite promotional treatment.
An SAP trade promotion optimization deployment handles planning, funds management and settlement well, and many large manufacturers will keep it. What it does not carry is a forward-looking consumer demand signal, so most brands pair it with a demand data layer rather than replacing it.
No. Consulting engagements suit full enterprise rollouts, but a demand layer can be tested on two or three accounts in a quarter without one. Start where the signal is clearest, for example an ingredient at an early lifecycle stage such as chickpea protein, where the volume assumption from last year is least reliable.





We’d love to learn your goals and see how Tastewise fits
We’d love to learn your goals and see how Tastewise fits
Get a personalized demo
Good taste. Wise move.
Your demo request is confirmed. We’ll reach out within one business day to schedule your walkthrough.
What happens next

See what’s driving demand, then turn it into a sell-in story for retailers and operators.
- Connect consumer panels, market trackers, and agents into one evidence view
- Get the “why” behind what’s changing, with explainable demand drivers
- Walk away with a buyer-ready narrative and next steps to activate
Trusted by





“Tastewise is my secret tool for knowing what consumers want next and why.“