


What’s new?
Consumer preferences change faster than most teams can act on them. The bottleneck has rarely been data access, it’s been the time and effort required to convert raw signals into a story your leadership, R&D, and commercial teams can align on and defend.
The Tastewise Consumer Insights Dashboard has been rebuilt from data-first to question-first. You ask a strategic market question in plain language and receive a curated, evidence-backed answer in seconds. Signal-to-noise ratio is dramatically reduced: no more digging through widgets to find the insight that matters.
The previous Tastewise Consumer Insights Dashboard gave CPG teams access to a broad set of panels, social discussion, foodservice, home cooking, trend lifecycles, and consumer motivations. The data was strong. But the experience demanded significant interpretation work: you arrived at the dashboard, set your filters, browsed the widgets, and then built the narrative yourself.
This update changes that model. The new dashboard is built around a single principle: make the answer obvious. You ask a strategic market question. The platform surfaces the most relevant evidence. You move.
The core shift: question-first insights
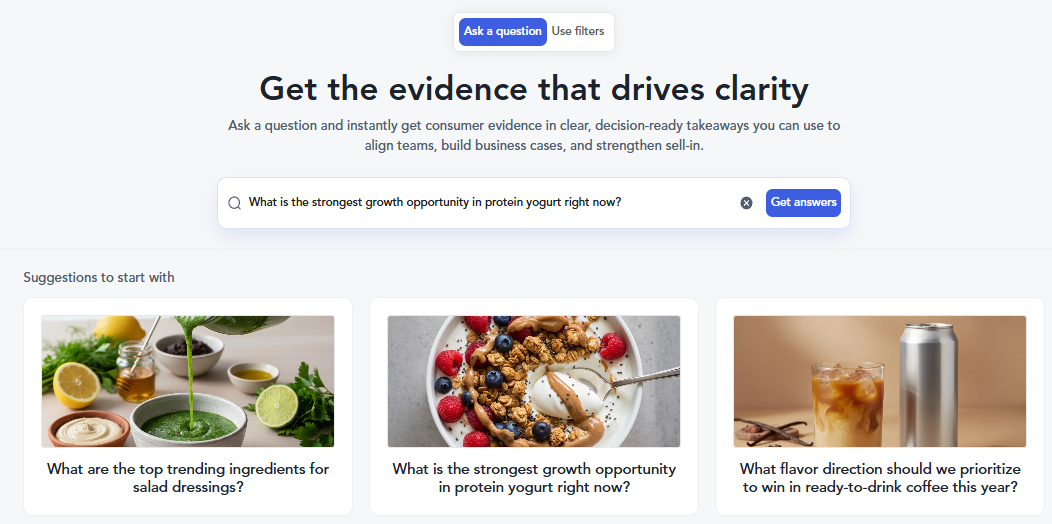
Instead of navigating to a dashboard and manually applying filters, you now start with the decision you need to make, typed in plain language. The AI interprets your question, queries the relevant data, and surfaces the insights that directly answer what you asked. Everything else stays out of the way.
The result is a dramatic improvement in execution speed. Teams that previously spent 45–90 minutes assembling an insight story are now getting to a shareable executive summary in under five minutes.
What does this means for CPG teams? Innovation leads, category managers, and R&D executives can now independently answer market questions like “What claims are gaining traction in functional beverages?” or “What is the innovation white space in frozen pizza for Gen Z?” , and have a presentation-ready answer in seconds, not days.
Natural language queries
Type a full strategic question. The system identifies the right data, filters, and widgets automatically.
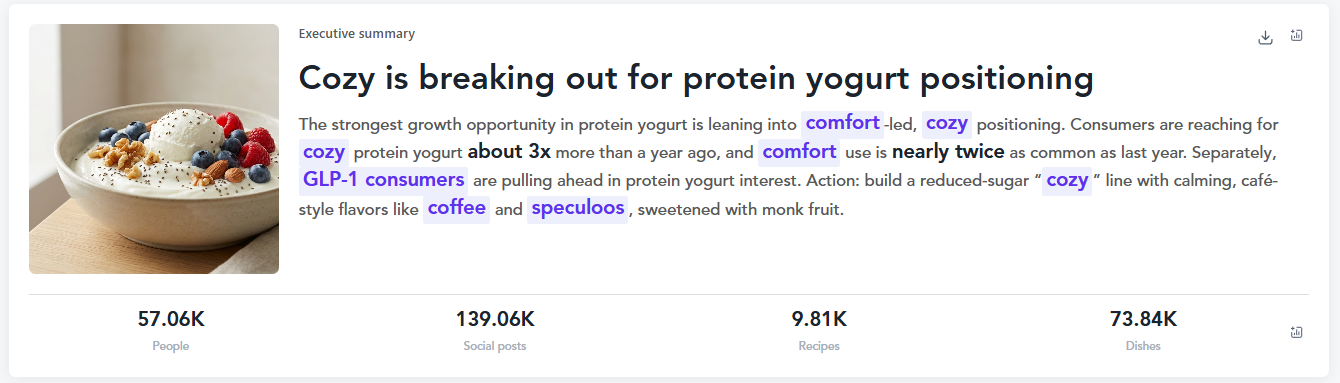
Executive summary, every time
Every query returns a curated executive summary with a named lead insight, supporting evidence, and a recommended action.
Takeaways built into charts
Every visualization now includes a written key takeaway on the left, so the “so what” is never buried.
Filters still available
Need to go deeper? Toggle to filter mode, adjust metrics, change visualizations, and refine the exact cut of data you need.
Before vs. after: what changed for CPG research workflows
The table below captures the practical workflow difference across core CPG research scenarios, from how you enter the platform to how fast you reach a decision-ready output.
| Scenario | ⚠ Legacy dashboard | ✓ New dashboard |
|---|---|---|
| Starting point | Navigate to the right section, set category filters, choose widgets manually | Type a plain-language question on the landing screen. Done. |
| Getting the insight | Interpret multiple charts across Consumer Needs, Trend Performance, and Ingredients tabs | Read the executive summary. Scroll for supporting evidence if needed. |
| Trend lifecycle mapping | Browse lifecycle stage widget manually; cross-reference with Trend Performance | Automatically surfaced based on your question, with early/emerging/trending/mature/declining stages flagged inline |
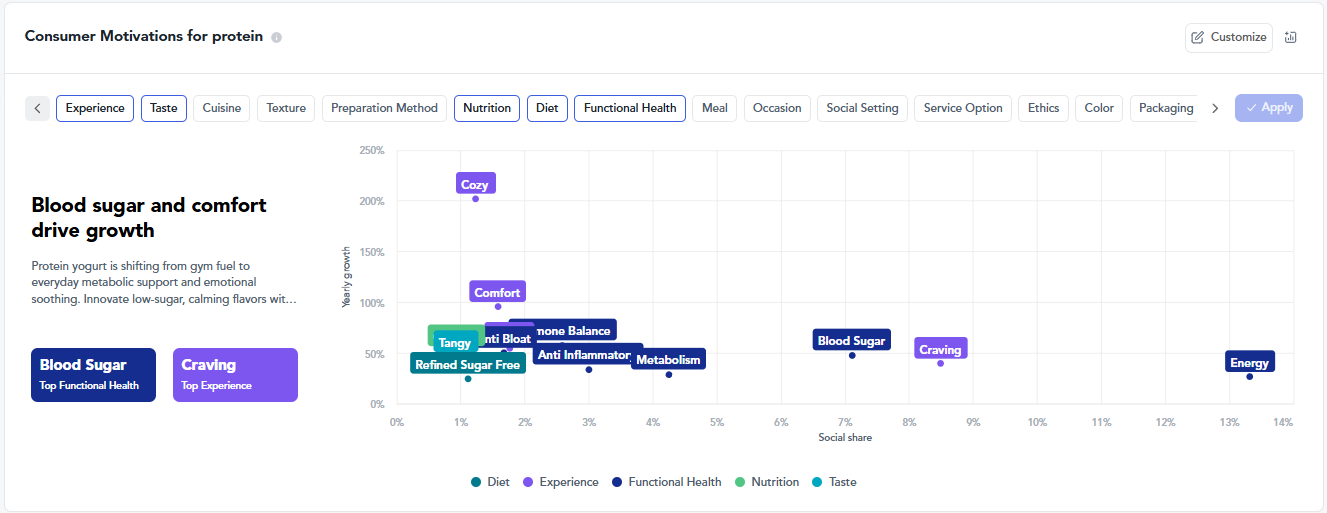
| Consumer motivations | Static bar chart showing top needs by social share | Dynamic scatter visualization with motivation map, audience breakdowns, and written takeaway |
| Sharing outputs | Export raw charts; rebuild narrative in slides manually | Export full analysis as PPTX, or individual widgets as PNG or CSV — with takeaways already written in |
| By-Audience insight | Not available in Trend Performance | New “By Audiences” tab in Trend Performance shows social discussion filtered by three key audience segments |
| Data integrity | Same statistically grounded panels | Same statistically grounded panels, all metrics calculated identically, now curated to your question |
Forecast demand before you commit development resources
One of the most common questions CPG innovation teams face is deceptively simple: is this idea worth pursuing now? The answer requires triangulating multiple signals, social momentum, menu adoption, repeat home usage, and the trajectory of consumer motivations around the concept.
The new dashboard makes this triangulation automatic. When you ask a demand-oriented question, “What emerging functional benefits are consumers seeking in energy drinks?” or “Which protein yogurt flavors are growing fastest right now?” , the platform pulls correlated signals across the Social F&B panel, foodservice data, and the home cooking panel simultaneously, and frames the answer as a predictive narrative rather than a raw data dump.
Predictive modeling based on current and emerging consumer signals has always been core to Tastewise’s methodology. What’s changed is the speed at which that modeling surfaces as a usable answer. Teams no longer need to commission a brief or schedule a call with an analyst to get a directionally confident read on demand trajectory.
- ~30% faster go-to-market for data-validated concepts vs. traditional research workflows
- <5 min from question to shareable executive summary with curated evidence
- 1 min to pressure-test a concept against live consumer signals before committing resources
Where does this ingredient sit in its lifecycle right now?
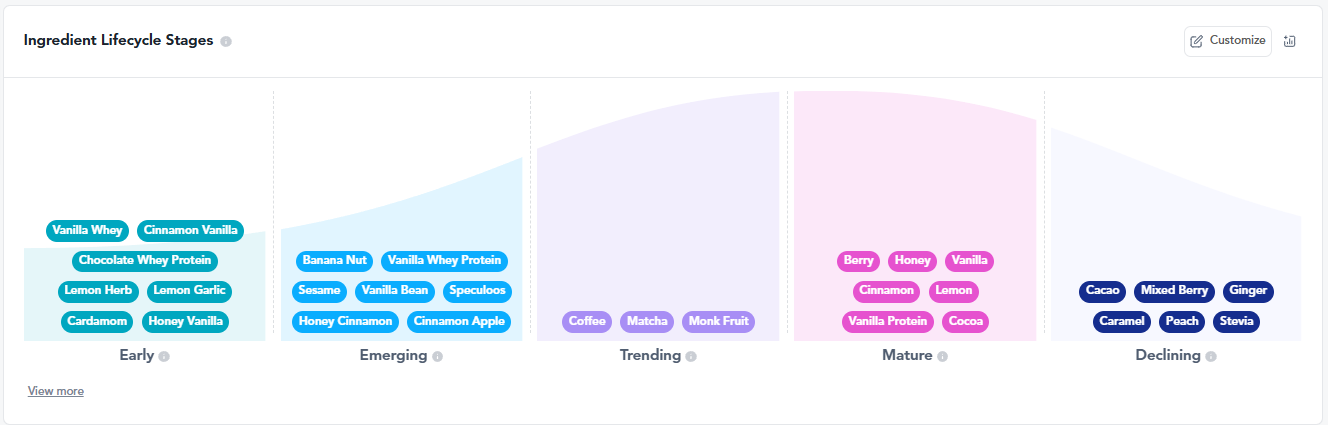
Timing is the hardest call in CPG innovation. Launch too early and your education costs outpace your category. Launch too late and the white space has closed. The previous dashboard had lifecycle data, it required you to know where to look for it.
In the new experience, ingredient lifecycle stages (early, emerging, trending, mature, declining) are surfaced automatically as part of the curated response to your question. If you’re asking about a specific ingredient or dish, the platform flags its lifecycle position and surfaces the relevant foodservice signals and home cooking panel data that either support or complicate the timing thesis.
The new Categories widget, absent in the legacy dashboard, also helps teams answer a question that drove significant inbound support volume: “Is this ingredient or flavor growing fastest in beverages, dairy, or snacks?” You can now see category-level comparison for any concept within a single query, without rebuilding your filters.
Omnichannel insight in one view: The updated Consumption Moments widget now surfaces platform-specific behavior across four tabs like social (Instagram), recipes (Pinterest), menus (Uber Eats), and retail shelf (eRetail), giving category managers a true omnichannel picture of where and how a concept is showing up.
How CPG teams share consumer insights with leadership without rebuilding the narrative
Consumer insights don’t create commercial impact while they sit in a dashboard. They create impact when they reach the right stakeholder, a retail buyer, a brand director, a product development lead, with enough clarity that the decision becomes obvious.
The previous workflow required teams to export charts, write their own narrative, and reassemble the story in slides. That process introduced delays and inconsistency; a chart without its written takeaway loses context quickly.
The new dashboard addresses this directly. Every visualization ships with a written key takeaway baked in. When you export, either the full analysis as a PPTX or individual widgets as PNG or CSV, the takeaways travel with the data. The sell-in story is built as you build the analysis, not afterward.
This matters most for teams that operate in a high-velocity commercial environment: sell-in presentations to retail buyers, internal alignment decks for R&D and marketing, and concept testing support that needs to move at the speed of a product brief rather than a research cycle.
See the new dashboard in action.
FAQs about Consumer Insights Dashboard
It’s a centralized product that connects social, foodservice, and home cooking behavior into a single view, helping teams prioritize, validate, and execute food and beverage decisions faster.
Traditional tools rely on static, historical data. Tastewise updates continuously using observed consumer behavior, allowing teams to make decisions based on what’s happening now.
Yes. The dashboard combines growth signals, lifecycle stages, and post-purchase behavior to help teams assess timing and demand before launch.
Yes. The Social F&B panel enables granular, country-level analysis while maintaining consistency across markets
Teams use dashboard outputs to show demand signals, timing justification, and consumer relevance in a format buyers can understand quickly.
Yes. Many teams validate ideas earlier using dashboard evidence, reducing reliance on expensive external testing.
Yes. The dashboard supports demand forecasting by surfacing predictive modeling based on current and emerging consumer signals , not historical survey data. You can ask questions like “Which protein yogurt flavors are growing fastest right now?” or “What emerging functional benefits are consumers seeking in energy drinks?” and receive a trend trajectory answer drawn from real-time social discussion, foodservice menu adoption, and home cooking behavior. Ingredient lifecycle stages (early, emerging, trending, mature, declining) are also surfaced automatically to help you pressure-test timing before committing development resources.
Yes, and this is one of the highest-value use cases for the new dashboard. Marketing teams can ask questions like “What claims are gaining traction in functional beverages?” or “What types of burger content are consumers engaging with most online?” and receive a curated, citation-ready answer with visualizations they can export directly into strategy decks. The executive summary format is specifically designed to support internal alignment conversations with leadership and cross-functional teams.


We’d love to learn your goals and see how Tastewise fits
We’d love to learn your goals and see how Tastewise fits
Get a personalized demo
Good taste. Wise move.
Your demo request is confirmed. We’ll reach out within one business day to schedule your walkthrough.
What happens next

See what’s driving demand, then turn it into a sell-in story for retailers and operators.
- Connect consumer panels, market trackers, and agents into one evidence view
- Get the “why” behind what’s changing, with explainable demand drivers
- Walk away with a buyer-ready narrative and next steps to activate
Trusted by


“Tastewise is my secret tool for knowing what consumers want next and why.“