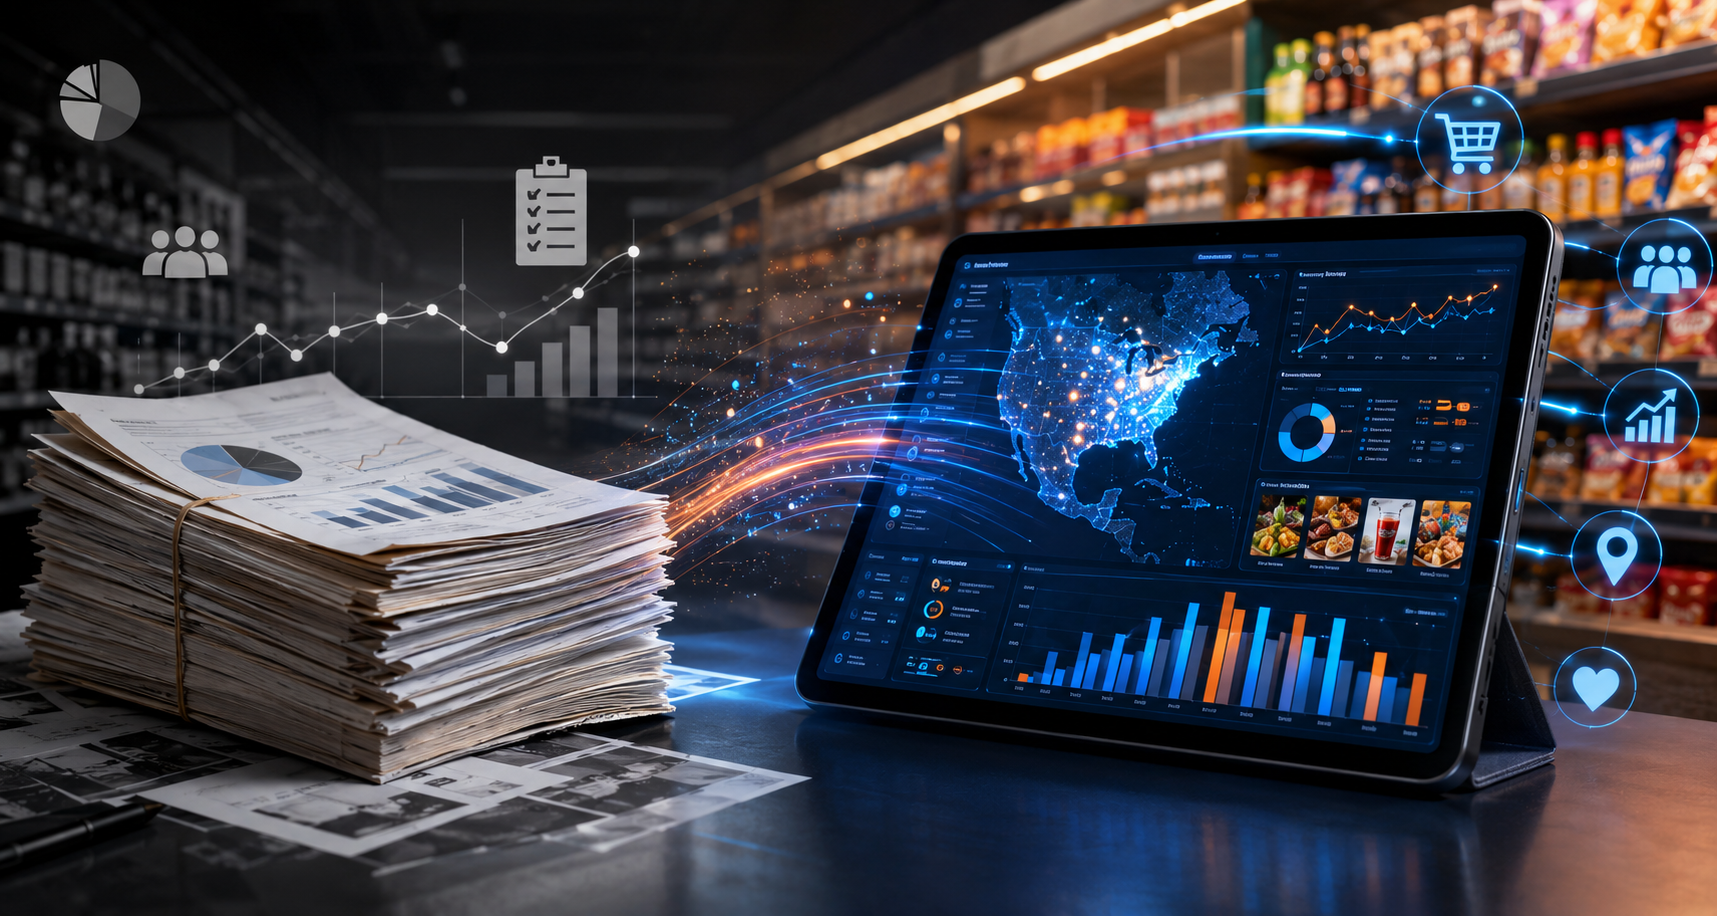
Retail data analytics sales improvement is no longer a back-office priority. It is the difference between brands that drive a category and brands that watch someone else do it. Consumer demand signals are shifting faster than monthly sell-in cycles allow, and brand teams that rely on delayed reports leave real revenue on the table. The good news is that Tastewise, the food intelligence platform for CPG and retail, now gives your team the real-time layer that closes the gap between a consumer’s intent and your shelf response. This guide walks through exactly how to turn retail analytics dashboard sales data into measurable category gains.
Key takeaways
- Real-time category data cuts the lag between consumer demand shifts and brand response from weeks to days. Your team can use live trend signals to update shelf narratives before competitors notice the opportunity.
- Whitespace in retail categories is not random. Specific ingredient and flavour combinations are growing without brand investment behind them. Identifying these gaps gives your team a data-backed expansion case for the next buyer meeting.
- Basket-affinity analytics reveal cross-merchandising opportunities your team would not find in a standard sales report. Secondary placement wins at premium endcaps often come down to having the right cross-category proof at the right moment.
- Regional variation in product performance is not noise. It is a signal. Brands that build geolocation views into their retail sales data analytics dashboard recover lost velocity faster by responding to local demand rather than averaging it out.
- E-commerce now accounts for 16.4% of total retail sales, and according to the Crisp retail data analytics guide, brands without granular analytics struggle to distinguish genuine sales velocity from supply chain losses, making accurate category performance data more critical than ever.
What retail data analytics sales improvement actually means for your team
Retail data analytics sales improvement describes the process of using real-time consumer signals, category performance metrics and sales trend data to increase revenue, reduce shelf-stall risk and sharpen sell-in narratives. For a category manager or brand director, this is not about more dashboards. It is about closing the distance between what consumers want today and what your planogram says tomorrow.
The Tastewise platform tracks demand across millions of consumer data points, covering ingredient growth, dish-level trends, consumer motivations and regional variation. In the past 12 months, categories with active real-time tracking have shown materially faster response to whitespace. Brands using live demand signals instead of historical scan data are pitching shelf resets with current proof, not last quarter’s numbers. The 2026 food and beverage trend forecast shows that the gap between leading and lagging brands now correlates directly with how early teams act on forward-looking category data.
The opportunity this creates is concrete. Your team can build a sell-in story that connects a specific consumer trend to a specific shelf gap, pair it with basket-affinity data for cross-category placement, and walk into a buyer meeting with a proof deck that retailers cannot dismiss. Retail category analysis gives your team the full picture, from national trend to regional velocity, in one integrated view.
Merging category performance and sales dashboards
A modern retail sales data analytics dashboard does more than report what sold. It connects sales velocity, ingredient growth and consumer motivation into a single live view your team can act on before a buyer meeting, not after. Most brand teams still work with two or three disconnected tools: one for scan data, one for social listening, one for internal forecasting. The problem is not data volume. It is data fragmentation.
When category performance and sales data live in separate systems, the lag between insight and action grows. A flavour combination trending in consumer data takes weeks to surface as a sales uptick in traditional reporting. By that point, a competitor has already pitched it. A merged dashboard view, built on live signals from food and beverage marketing and retail intelligence, collapses that timeline. Your team sees the demand signal when it is still a whitespace, not when it has become a lost sale.
The shift from passive tracking to proactive category management starts with how your team structures its data view. Pull consumer trend data and sales metrics into the same cadence. Set alert thresholds on ingredient growth. Flag SKUs where consumer demand is rising but distribution has not yet responded. That is the operational model that turns retail data analytics into a sales improvement engine.
Identifying whitespace gaps via real-time retail data analytics
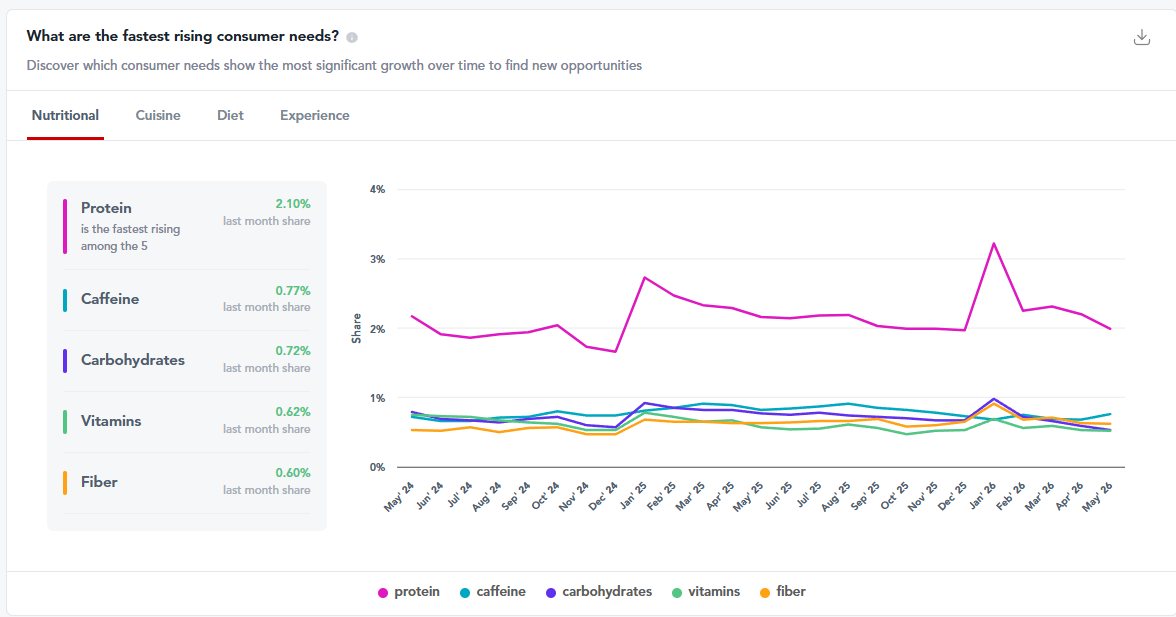
Whitespace in a retail category is a consumer demand signal with no brand response behind it. These gaps do not announce themselves in a quarterly sell-out report. They show up in forward-looking trend data, before the sales uplift hits the shelf. The big data approaches to retail category analysis show that brands tracking ingredient-level demand signals in real time identify whitespace an average of six to eight weeks before it registers in scan data.
For your team, this means treating ingredient and dish growth data as a planning input, not a historical reference. When a specific flavour profile or health claim is growing in consumer demand but has no major SKU backing it in your category, that is a product brief waiting to happen. It is also a sell-in argument. Retailers respond to proof that consumer demand exists and that your brand is the one positioned to capture it.
The retail analytics statistics that matter here are not just growth rates. They are velocity trends paired with distribution gaps. A flavour growing 30% in past-year consumer demand with limited shelf presence in a key region is a far more compelling category pitch than a generic trend report. Build your whitespace case around that combination and your team arrives with a story the buyer has not already heard.
Building a winning shelf-reset narrative with retail analytics dashboard sales data
A shelf-reset pitch lives or dies on the proof behind it. Buyers at major grocery chains receive dozens of category review submissions every quarter. The ones that get approved connect consumer demand directly to a specific SKU, a specific gap and a specific revenue case. Retail analytics dashboard sales data is what makes that connection concrete and defensible.
Your team’s shelf narrative should move in three steps. First, establish that consumer demand for a specific attribute or ingredient is growing in the retailer’s key demographic. Second, show that current shelf allocation does not reflect that demand. Third, present the specific SKU, the projected velocity and the comparable performance in a matching region where the gap has already been closed. That structure gives the buyer a clear yes-or-no decision, not an open-ended pitch to consider.
The CPG retail guide outlines how leading brands are building these narratives using live consumer data rather than retrospective scan reports. The difference is not presentation quality. It is the age of the evidence. A pitch built on current signals wins the shelf conversation that last quarter’s data cannot.
Maximizing basket value with cross-pairing analytics
Cross-merchandising wins at retail are not random. They follow consumer behaviour patterns that show up in basket-affinity data before they show up in sales. When consumers are already pairing two product types at home or in foodservice settings, the case for co-locating them on shelf, or winning a secondary endcap, becomes measurable and defensible.
The AI retail customer analytics driving basket-affinity insight today go beyond simple purchase correlation. They surface the consumer motivation that connects two categories: a health claim, a preparation occasion, a flavour combination. When your team can tell a buyer that consumers purchasing your product are also actively seeking a specific adjacent category, the endcap conversation changes from a favour to a revenue argument.
To build a cross-pairing case, pull basket-affinity data at the ingredient or attribute level. Identify which consumer motivations connect your SKU to the adjacent category. Frame the endcap or secondary placement as a basket-value opportunity for the retailer, not just a distribution win for your brand. That reframe, from brand ask to retailer revenue, is what converts a shelf placement request into a category conversation.
Navigating geolocation and regional sales variations in retail data analytics
The same product does not behave the same way in every region. A SKU driving strong velocity in the Pacific Northwest may be stalling in the Southeast because the consumer motivation behind it does not translate equally. Regional sales variation is not a distribution problem. It is a consumer insight problem, and your retail analytics dashboard is where the answer starts.
The food and beverage retail industry trends show that regional flavour preference divergence is accelerating. Consumer demand for spice levels, health claims and ingredient provenance varies significantly by market, and brands that apply a single national strategy to regional shelf sets leave velocity on the table. The fix is not to run separate strategies for every market. It is to build regional demand signals into your category planning layer so the shelf set reflects local consumer behaviour.
Practically, this means building geolocation filters into your regular analytics review. Flag the SKUs where national performance masks strong regional signal. Identify the markets where a specific consumer motivation is over-indexing relative to the national baseline. Use that data to prioritise regional sell-in conversations with the retailer accounts where the case for range extension or shelf optimisation is strongest. Regional variation is where the most immediate revenue recovery lives for most CPG teams.
FAQs about retail data analytics sales improvement
Retail data analytics sales improvement is the process of using live consumer signals, category trend data and sales performance metrics to identify gaps, optimise shelf presence and improve revenue outcomes. For CPG brands, it matters because the window between a consumer demand shift and a competitor shelf response is shrinking. Teams with access to real-time retail category data close that window faster than teams working from delayed scan reports.
A retail analytics dashboard pulls together consumer demand signals, sales velocity and category trend data in one view. This lets your team identify whitespace, build shelf-reset narratives with current proof and respond to regional variation before it becomes a lost sale. The improvement comes from cutting the lag between insight and action, not from reporting what already happened.
Traditional category management tools report historical scan data: what sold, where and when. Retail sales data analytics adds forward-looking consumer signals, ingredient trend data and basket-affinity metrics to that view. The practical difference is that analytics-led category teams can pitch a shelf change before consumer demand peaks, while traditional tools confirm the opportunity after a competitor has already taken it.

Read more from Kelia Losa Reinoso
Foodservice Report – Trends Towards 2024

Menu Innovation In 2026: How Enterprise Foodservice Teams Turn Consumer Data Into Operator Wins

How To Use AI For Food Brands To Turn Failed Research Into Revenue