





Modern retail category management cannot run on monthly sales updates that land weeks after the shelf has moved. The salmon rice bowl TikTok trend shows why. A home lunch posted in 2021 still shapes what US consumers order, cook and buy. To drive retail data analytics sales improvement around a social movement like this, you need two views at once. Your retail analytics dashboard sales data tells you what sold. Real-time demand signals tell you why it sold and where demand is heading. This guide uses Tastewise US data from the past 12 months to show how you turn those signals into placement, assortment and revenue wins.
Key takeaways on the salmon rice bowl TikTok trend
- US consumer interest share in salmon rice bowls rose 9.8% over the past 12 months, while the broader salmon bowl term slipped 6.7%.
- Salmon bowl menu items on US restaurant menus grew 18% in a year, at an average price of $20.61 per item.
- The online shelf carries 846 products tied to salmon and rice bowls from 298 brands, yet only 4 new SKUs launched in the past 12 months.
- Convenience Seekers are 3.8x more likely than the average consumer to engage with salmon rice bowls, and Protein Prioritizers follow at 3.7x.
- Meal prep occasions for the dish grew 18%, and snack occasions grew 36%.
- New Jersey gained 11% share of US restaurant locations serving salmon bowls, while California lost 8% despite holding about 1 in 5 of those locations (20%).
Merging category performance and sales dashboards
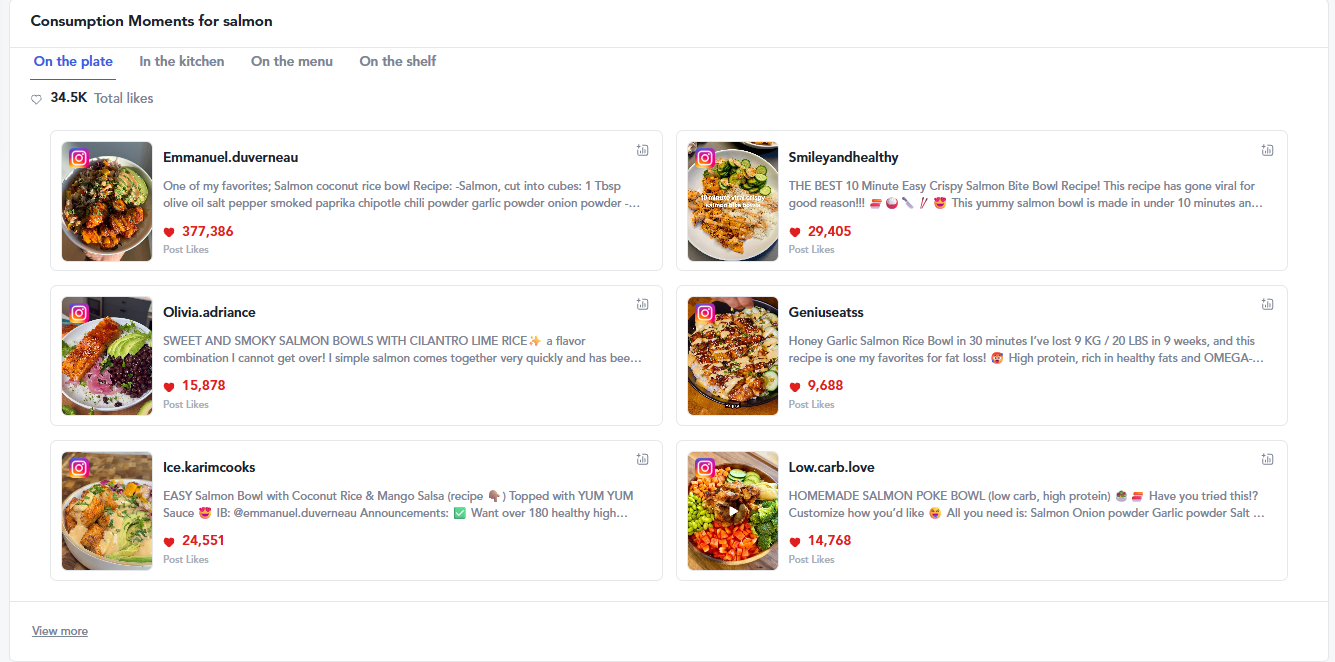
Your sales dashboard records the outcome. A retail sales data analytics dashboard becomes proactive only when you place demand data beside it. The tiktok salmon rice bowl trend is a clear test case, because the dish name you track changes the answer.
Across the Tastewise US consumer panel, consumer interest share in salmon rice bowls rose 9.8% over the past 12 months. Consumer interest share is the portion of US food interest that goes to one dish. The broader salmon bowl term fell 6.7% over the same window. A category view that rolls every salmon bowl into one line would read that as flat demand. The specific rice bowl build is the part that is moving.
Restaurant menus confirm the direction. US menus now carry 34,372 salmon bowl items, up 18% from a year earlier. Items per operator barely moved, which means growth is coming from more restaurants adding the dish. The average menu price reached $20.61, up 3.1% in a year. At home the picture is calmer, with recipe interest in salmon rice bowls down 0.6%. Demand is shifting from cooking the bowl to buying it ready-made.
That shift is the revenue case for retail. Here is what to do with it:
- Map your SKUs to dish-level terms such as salmon rice bowl.
- Put monthly menu item counts beside weekly sell-through, so a rise on menus flags the next shelf opportunity before your sales data does.
- Brief your retail sell-in team on the menu price gap, since a ready-to-eat bowl competes with a $20 restaurant order.
The Tastewise platform tracks these dish-level signals monthly, so you can refresh the view before each buyer meeting.
Identifying whitespace gaps via real-time trends
Backward-looking reports tell you what already sold. They cannot show the demand nobody is serving yet. The salmon rice bowl avocado soy sauce ice cube trend has a large audience and a thin pipeline of new products.
The US online shelf carries 846 products tied to salmon and rice bowls, from 298 brands across 48 retailers. Only 4 new SKUs launched in the past 12 months. Born Simple added 2, Kirkland Signature added 1 and Otafuku added 1. A shelf that crowded with so few launches leaves room for a brand that builds the full bowl in one pack.
The ingredients consumers add tell you what that bowl should hold. In Tastewise data, seaweed as a pairing with salmon rice bowls rose 15% over the past 12 months. Miso follows at 11.6%. Edamame carries an index of 4.8x. An index shows how much more often a pairing appears with this dish than with the average dish. Each sits at an early lifecycle stage, so the window to own them is open.
The broader salmon trend points the same way. Plain formats such as baked salmon and salmon fillet are mature and losing ground, each down about 11%. Consumers still want salmon. They want it inside a seasoned bowl build.
Occasions show where to launch first. Snack occasions for salmon rice bowls grew 36% and breakfast occasions grew 34%, both from a small base beside lunch. Your actions:
- Test a miso and seaweed salmon rice bowl kit that matches the pairings consumers are adding.
- Add edamame as a side compartment, since it already over-indexes with the dish.
- Pilot a snack-size cup for the afternoon occasion before competitors fill it.
Feed these gaps into your product innovation pipeline as concepts with demand data attached.
Building a winning shelf-reset narrative

A retail buyer needs a reason to move facings. The salmon rice bowl ice cube reheating trend gives you one. The ice cube steams leftover rice and salmon in the microwave, and its spread signals that consumers want reheat-and-eat food that still tastes fresh. Pair that story with your own retail analytics dashboard sales data and you have a reset pitch built on demand.
Start with who buys. Convenience Seekers engage with salmon rice bowls 3.8x more than the average consumer. Protein Prioritizers sit at 3.7x and grew 5.8% over the past 12 months. Health Conscious consumers engaging with the dish grew 14%. These are the consumer segments your reset should be built around.
Then show the occasion. Lunch accounts for nearly 3 in 20 salmon rice bowl occasions (15%), and that share grew 21%. Meal prep over-indexes at 3.9x. A buyer reads that as repeat purchase across the working week.
Then show the gap. The current shelf leans on canned and pouch salmon. Chicken of the Sea carries 31 SKUs at an average of $8.28. Bumble Bee carries 25 at $9.58, and Great Value carries 18 at $7.96. The shelf average for products tied to salmon and rice bowls is $10.41, about half the $20.61 restaurant average. Kroger already sells a Snowfox salmon and tuna poke rice bowl at $11.99, so grocery shoppers already see a ready-to-eat bowl at this price point.
Build your reset ask in three parts:
- Lead with the audience index, so the buyer sees a defined and measurable shopper.
- Show meal prep and lunch growth to argue for high-velocity, multi-pack SKUs.
- Position your bowl between $10 and $12, below the restaurant order and close to the deli benchmark.
For the wider playbook on buyer meetings, read our CPG retail guide.
Maximizing basket value with cross-pairing analytics
Your loyalty and basket data shows which products already land in the same cart. Pairing data shows which foods consumers want in the same bowl. When you combine the two, you can pitch a cross-merchandising display or premium endcap with evidence for every item on it.
The smoked salmon trend is the strongest pairing story. Smoked salmon holds nearly 3 in 20 of US consumer interest in salmon dishes (13%), and Tastewise classes it as trending. That share eased 4.8% over the past 12 months, so the opportunity sits in new uses such as rice bowls. Restaurants are already testing that move. Loro Asian Smokehouse in Austin sells an Oak Smoked Salmon Rice Bowl at $17.50. On shelf, Acme Smoked Fish and Honey Smoked Fish Co carry 17 SKUs each, which gives you an endcap anchor.
The salmon sushi bowl crispy rice trend sits inside a wider family of rice-forward salmon formats. Sushi bake is trending and grew 13%. Oshizushi is emerging and grew 64%. Ikura don is at an early stage and grew 16%. Teriyaki salmon is declining, down 17%, which tells you which sauce story to retire.
Snack formats add a second display. Candied salmon grew 76% and salmon jerky grew 55%, both from small bases.
The shoppers to target are clear in the data. Trader Joe’s shoppers engage with salmon rice bowls about 2x more than average, and Whole Foods shoppers 1.7x more. Use those retailers for your first premium endcap pitch:
- Build a salmon rice bowl endcap with smoked salmon, microwave rice, seaweed snacks and Japanese-style mayo.
- Add a sushi bake or pressed sushi kit as the premium tier for the weekend occasion.
- Place candied salmon or salmon jerky at the register end as an impulse add-on.
More ways to turn category signals into retail wins sit in our CPG insights guide.
Navigating geolocation and regional sales variations
The salmon rice bowl TikTok trend source is a lunch video that creator Emily Mariko posted in September 2021. She flaked leftover salmon over rice, added an ice cube, microwaved it under parchment and finished it with soy sauce, Kewpie mayo and sriracha. Within weeks, a Good Morning America report counted more than 212 million views on the #SalmonRice tag. Five years on, the salmon rice bowl trend behaves very differently from one region to the next.
California holds about 1 in 5 US restaurant locations that serve salmon bowls (20%). Its share of those locations fell 8% over the past year. New York holds nearly 1 in 10 (10%) and gained 3%. Florida held steady at nearly 1 in 10 (9%). Share in this section means each state’s portion of all US restaurant locations serving the dish.
The growth is moving east. New Jersey gained 11% share, Ohio gained 7%, Massachusetts gained 5% and Pennsylvania gained 4%. For the 2026 salmon rice bowl trend, a national dashboard view hides that split. Demand in New Jersey and Ohio may be climbing while California flattens.
Chain data adds a second regional layer. Applebee’s serves salmon bowls in more US locations than any other chain in Tastewise data. Red Lobster, Ruby Tuesday and Long John Silver’s each lost close to a fifth of their share of locations serving the dish. Teriyaki Madness gained 2.5%. Price spread is wide too. Long John Silver’s added a Grilled Salmon Rice Bowl at $11.09, while Kings of Kobe lists a Wasabi Salmon Bowl at $30.80.
Build your regional plan around those differences:
- Lead shelf resets in New Jersey, Ohio, Massachusetts and Pennsylvania, where restaurant share is rising.
- Defend California with value packs, since its share of locations there is falling.
- Match your price tier to the local menu benchmark, from the $11 quick-service bowl to the $30 premium bowl.
Share these regional splits with your foodservice operators and retail buyers in the same meeting, so both channels plan around the same map.
Salmon rice bowl next steps for brand teams

The salmon rice bowl has moved from a home lunch hack to a menu staple with an underbuilt retail shelf. Menus are adding it, convenience and protein shoppers over-index on it, and new launches are scarce. Your own sales data will confirm the opportunity once it arrives. Tastewise shows you the demand, pairings and regions first, so your next reset is built before the shelf moves.
Frequently asked questions about the salmon rice bowl TikTok trend
The salmon rice bowl TikTok trend is a bowl of flaked cooked salmon and rice, reheated with an ice cube and finished with soy sauce, mayo, sriracha and avocado. Tastewise data shows On the Go Snackers engaging with the dish grew 173% over the past 12 months, from a small base.
The trend began with a lunch video that creator Emily Mariko posted on TikTok in September 2021. The home cooking side has since settled, with US recipe interest in salmon rice bowls down 0.6% over the past 12 months.
The ice cube releases steam in the microwave, which keeps leftover rice and salmon moist under parchment paper. The method suits planned family meals, and Tastewise data shows Family Meal Planners engage with the dish 2x more than the average consumer.
The salmon rice bowl trend is holding steady at home and growing on restaurant menus in 2026. Tastewise forecasts US consumer demand for the dish to stay level through August 2027.
Smoked salmon is moving into rice bowl builds, such as the Oak Smoked Salmon Rice Bowl at Loro Asian Smokehouse in Austin. Tastewise data classes Norwegian smoked salmon as an early-stage dish, up 2.9% over the past 12 months.

Read more from Kelia Losa Reinoso

We’d love to learn your goals and see how Tastewise fits
We’d love to learn your goals and see how Tastewise fits
Get a personalized demo
Good taste. Wise move.
Your demo request is confirmed. We’ll reach out within one business day to schedule your walkthrough.
What happens next

See what’s driving demand, then turn it into a sell-in story for retailers and operators.
- Connect consumer panels, market trackers, and agents into one evidence view
- Get the “why” behind what’s changing, with explainable demand drivers
- Walk away with a buyer-ready narrative and next steps to activate
Trusted by





“Tastewise is my secret tool for knowing what consumers want next and why.“