





Classic Coca-Cola held 18.5% of US soda sales volume in 2025, according to Beverage Digest figures reported by the Atlanta Journal-Constitution. Its own volume fell 5.3% in the same year. That gap between share and momentum sits at the center of coca cola vs pepsi in 2026. Pepsi climbed back to third place with roughly flat volume, while zero-sugar colas, prebiotic sodas and restaurant pouring contracts became the places where drinkers switch. This guide compares both brands on taste, products and market share. It also covers sales, stock performance, restaurants and ads. The analysis uses Tastewise menu, retail shelf and consumer data for the US over the past 12 months, alongside the companies’ own published results.
Key takeaways
- Classic Coke led US soda volume in 2025 with an 18.5% share, while Pepsi returned to third place behind Dr Pepper.
- Coca-Cola appears on the menus of more than 1 in 3 US restaurant operators Tastewise tracks, about twice the reach of Pepsi at roughly 1 in 6.
- Pepsi menu items grew 18% over the past year against 13% for Coca-Cola, a lift that lines up with Subway’s 2025 move to PepsiCo.
- Coke Zero Sugar held a 4.6% share of US soda volume in the first nine months of 2025, more than three times the 1.4% held by Pepsi Zero Sugar.
- Coca-Cola shares returned about 84% over the five years to mid-September 2026, against about 3% for PepsiCo.
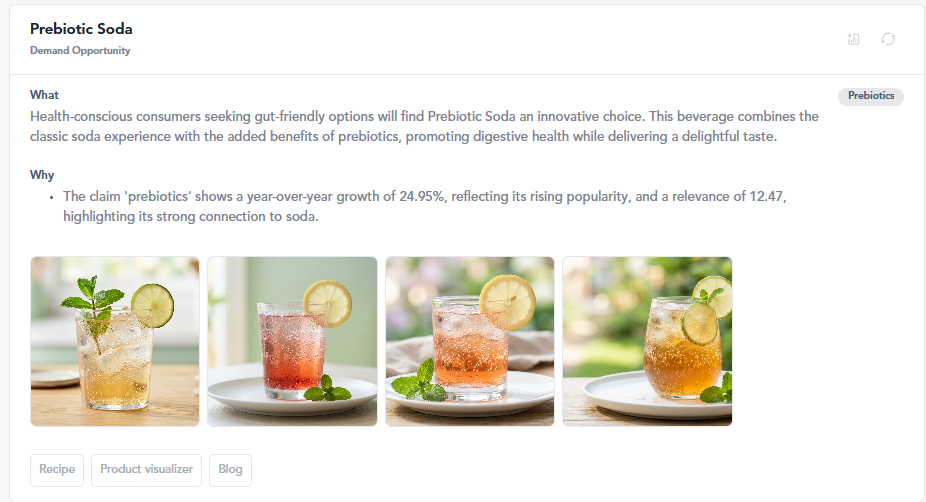
- Around soda, clean energy grew 38% and prebiotics grew 19% as claims in Tastewise consumer data, and prebiotics is the claim behind Poppi and Simply Pop.
What is the difference between Coca-Cola and Pepsi?
Coca-Cola vs Pepsi is a contest between two iconic colas that differ in formulation and in business strategy. Coca-Cola has a vanilla and raisin profile and sits inside a company focused purely on beverages. Pepsi cola vs coca cola tastes sweeter and more citrus-forward, and it sits inside PepsiCo’s wider food and snack portfolio.
Sensory profiles and blind taste testing analysis
The two ingredient lists overlap almost completely. Both colas are built on carbonated water and high fructose corn syrup. Each also lists caramel color, phosphoric acid, caffeine and natural flavors. Pepsi adds citric acid, which Coca-Cola does not list. A 12-ounce can of Pepsi also carries 41 grams of sugar against 39 grams in Coca-Cola.
Those two differences explain the sweeter, brighter first sip that tasters report in Pepsi. Coca-Cola carries about 45 milligrams of sodium per 12-ounce can against 30 milligrams in Pepsi. Tasters often describe Coke’s finish as drier and less sweet, and that extra sodium is one commonly cited reason. Malcolm Gladwell summed up the contrast in Blink, describing Pepsi as sweeter with a citrus burst and Coke as more raisin and vanilla.
Coca-cola vs pepsi taste test results depend heavily on who runs the test and how. Pepsi launched the Pepsi Challenge in 1975 and revived it for its 50th anniversary in 2025, this time pitting Pepsi Zero Sugar against Coke Zero Sugar. Pepsi says the 2025 tour collected more than one million samples across 34 markets, with 66% of tasters choosing Pepsi Zero Sugar. Treat that figure as company-reported marketing data. Gladwell also argued in Blink that a single sip tends to reward the sweeter drink, which a full can does not always confirm.
Coca cola vs pepsi products follow the same three-tier ladder. Each brand runs a flagship cola, a diet line (Diet Coke and Diet Pepsi), a zero-sugar line (Coca-Cola Zero Sugar and Pepsi Zero Sugar) and flavored extensions such as Cherry Coke and Pepsi Wild Cherry. On US e-commerce shelves Tastewise tracks, Pepsi lists 429 cola products against 380 for Coca-Cola across its Coca-Cola and Coke brand listings. Coca-Cola has been the more active launcher, with 13 new cola SKUs in the past 12 months against 3 for Pepsi. Average online shelf prices sit close together, at $7.44 for Coca-Cola and $7.59 for Pepsi.
Zero sugar is where pepsi vs coca-cola competition is sharpest. Beverage Digest data shared with Marketing Dive puts Coke Zero Sugar at a 4.6% share of US soda volume in the first nine months of 2025, against 1.4% for Pepsi Zero Sugar. Pepsi Zero Sugar grew volume 18.1% in that period, against 4.8% for Coke Zero Sugar. On US restaurant menus, Coke Zero Sugar appears at about 1 in 10 operators Tastewise tracks, roughly 1.7 times the reach of Pepsi Zero Sugar. Pepsi Zero Sugar menu items grew 29% over the past year, against 19% for Coke Zero Sugar.
Market dominance, global sales and financial growth
Coca cola vs pepsi market share looks different at brand and company level. At brand level, Beverage Digest’s 2025 ranking places Classic Coke first and Dr Pepper second at 8.8%. Pepsi ranks third, ahead of Diet Coke in fourth and Sprite in fifth. Pepsi volume stayed about flat in 2025 after several years of decline. At company level, Beverage Digest reported that Coca-Cola held a 40 share of US retail soft drinks through the first three quarters of 2024, against 27 for PepsiCo.
Pepsi vs coca cola market share in restaurants follows a similar pattern. Coca-Cola appears on the menus of more than 1 in 3 US restaurant operators Tastewise tracks, while Pepsi appears at roughly 1 in 6. Menu share here means the portion of tracked operators whose menus list the brand. Coca-Cola’s menu share has held steady over the past 24 months, and Pepsi’s stepped up in January 2025 and has held since.
Coca cola vs pepsi sales tell a story about two different companies. The Coca-Cola Company reported full-year 2025 net revenues of $47.9 billion, up 2%, with organic revenue up 5%. Organic revenue strips out currency moves, acquisitions and divestitures. PepsiCo reported 2025 net revenue of $93.9 billion, up 2.3%. Beverages made up 42% of that revenue and food made up 58%, with 56% earned in the US.
On those figures, PepsiCo’s beverage revenue comes to about $39 billion, below Coca-Cola’s $47.9 billion. PepsiCo is still about twice the size once snacks are counted, which frames every pepsi vs coca cola sales comparison. The two models produce different margins. Coca-Cola sells concentrate to bottlers and reported a comparable operating margin of 31.2% for 2025. PepsiCo makes, distributes and sells much of its own product, including Lay’s and Doritos through its foods business.
Coca cola vs pepsi stock performance last 5 years shows the widest gap of any metric here. 24/7 Wall St reported in September 2026 that Coca-Cola shares returned about 84% over five years, against about 3% for PepsiCo. The same report put Coca-Cola’s dividend yield at 2.38% and PepsiCo’s at 4.21%, with trailing price to earnings ratios of 26 and 18. PepsiCo announced its 54th consecutive annual dividend increase in February 2026.
A structured swot analysis coca cola vs pepsi sets these figures side by side.
| SWOT | Coca-Cola | PepsiCo |
| Strengths | Global distribution through bottling partners, the top US soda brand by volume, and a high-margin concentrate model | Snack portfolio that includes Lay’s and Doritos, plus beverage brands beyond cola such as Gatorade and Mountain Dew |
| Weaknesses | Heavy reliance on beverages, with Classic Coke volume down 5.3% in 2025 | Lower margins than Coca-Cola, and US beverage volumes that declined through 2025 |
| Opportunities | Zero-sugar growth and a prebiotic entry through Simply Pop | Faster zero-sugar growth, the Subway contract and Poppi in prebiotic soda |
| Threats | Functional sodas taking share of drinking occasions from classic colas | Snack softness in North America and a five-year share price that has barely moved |
Restaurant exclusivity and advertising rivalry
Coca cola vs pepsi restaurants is a contest of exclusive pouring contracts. Most chains serve one company’s fountain drinks across every location. In Tastewise data, the chains carrying Coca-Cola in the most US locations include McDonald’s, Burger King, Domino’s and Wendy’s. Subway leads the Pepsi list, followed by Taco Bell, Pizza Hut and Little Caesars.
A major recent shift came from Subway. The chain signed a 10-year deal with PepsiCo and began moving its roughly 21,000 US locations off Coca-Cola on January 1, 2025. Tastewise menu data shows the switch clearly. Pepsi menu items grew 18% over the past year against 13% for Coca-Cola. Subway’s share of US locations listing Pepsi rose 47% over the past year, while its share of locations listing Coca-Cola fell 83%. Moves like this are rare, since Arby’s switched from Pepsi to Coke in 2018 and Culver’s made the same move in 2023.
Pricing on menus also differs. The average Coca-Cola menu item in the US sells for $3.93, up 5% over the past year. The average Pepsi menu item sells for $4.19, up 0.4% over the same period. Restaurants carrying Coca-Cola list close to three Coca-Cola items per operator on average, slightly more than for Pepsi. Both figures cover the fountain sizes, combos and bottled options that operators list on their menus.
Coca cola vs pepsi ads have shaped the rivalry for 50 years. The original Pepsi Challenge in 1975 used blind taste tests as advertising, and Coca-Cola answered with New Coke in 1985 before restoring its original formula. Modern coca cola vs pepsi ads follow the same playbook on zero sugar. Pepsi vs coca cola ad strategy now leans on direct comparison, while Coca-Cola leans on its own brand and its place at the table.
A prominent recent coca cola vs pepsi commercial is Pepsi’s Super Bowl LX spot, The Choice. Directed by Taika Waititi, it shows a polar bear, long linked to Coca-Cola advertising, picking Pepsi Zero Sugar in a blind test. Coca-Cola took a different route with And a Coke, its first national foodservice campaign in the US. That campaign frames Coke as the drink that completes a restaurant meal, which plays directly to its fountain contracts.
The 2027 Food Trends Forecast ranks the 10 trends Tastewise expects to shape food and beverage demand next year, including the drinks moving into menus and shelves.
How Tastewise.io uses data-driven insights to predict soft drink trends

Tastewise combines consumer social data, home consumption data, restaurant menus and e-commerce shelves to read demand for coca cola vs pepsi month by month. That puts brand and category shifts in front of beverage teams well before the next quarterly earnings release.
Zero-sugar and functional cola demand
Health is reshaping why people choose a soda. Across the Tastewise US consumer panel, a claim is the health, diet or lifestyle reason consumers attach to a food or drink. Around cola and soda over the past 12 months, clean energy grew 38%, B vitamins grew 34% and better-for-you grew 28%. Electrolytes grew 24%, caffeine free grew 21% and prebiotics grew 19%.
Prebiotics has the highest index of these seven claims. It over-indexes about eight times on soda compared with the wider beverage set Tastewise tracks. Weight loss drugs also grew 29% as a claim around soda, a likely sign that GLP-1 use is shaping soda choices. Each of these claims maps to a product decision across coca cola vs pepsi products, from zero-sugar reformulation to caffeine-free and electrolyte line extensions.
Brand interest is uneven too. In the US food and beverage social data Tastewise tracks, Coca-Cola holds about five times the consumer interest share of Pepsi. Coca-Cola’s consumer interest share rose 3% over the past year, while Pepsi’s was close to flat.
Foodservice and dining analytics
Menu data shows pouring contracts as they change hands. The Subway switch appeared in Tastewise menu data in January 2025, the month the transition began. Brand teams and distributors can use the same view for foodservice sell-in, tracking which chains and independent venues list pepsi vs coca cola and how prices move.
The same approach works on the shelf. Retail sell-in teams can compare SKU counts, new launches and average prices for each brand by retailer. Pairing menus and shelves with consumer segments shows which drinkers sit behind each channel, from Gen Z to GLP-1 users.
A Tastewise demo walks through cola menu share, shelf launches and consumer claims for your own brands and competitors.
Real-world success: driving beverage category growth through AI analytics
Beverage brands and foodservice operators use Tastewise to measure market share shifts, test brand positioning and lower the risk of a retail launch. Functional soda shows how that works in practice, because both Coca-Cola and PepsiCo have already placed large bets there.
Step one is reading demand. Tastewise data shows clean energy, electrolytes and prebiotics among the seven fastest-rising claims around soda, with prebiotics most strongly tied to the category. That gives a beverage team a short list of reasons to buy that consumers already attach to soda.
Step two is reading the shelf. In prebiotic soda on US e-commerce shelves, Poppi holds 17 products and Olipop holds 13. Simply, the brand behind Coca-Cola’s Simply Pop, holds 3. PepsiCo closed its $1.95 billion acquisition of Poppi in May 2025. Coca-Cola launched Simply Pop in February 2025 with 6 grams of prebiotic fiber and no added sugar.
Step three is reading price. Simply products average $2.73 on the shelf, against $4.05 for Olipop and $6.35 for Poppi. That places Coca-Cola’s entry at the value end and PepsiCo’s at the premium end of the same segment. The coca cola vs pepsi market share contest in classic cola is now repeating in functional soda, with each company holding a different price position.
Step four turns the data into a swot analysis coca cola vs pepsi for the segment and a plan. Three concrete moves follow from these figures. A challenger brand could test an electrolyte cola in convenience stores. A foodservice operator could add a prebiotic soda next to its fountain line and track uptake. A CPG team could brief its product innovation pipeline on a caffeine-free prebiotic cola, matching two of the fastest-rising claims.
The same steps apply to any adjacent category, from energy drinks to sparkling water. Teams that need the messaging side can carry the findings into consumer marketing, while the wider method is covered in our guide to CPG insights.
Track the cola category with Tastewise
Coca-Cola leads on menus, volume and five-year returns. Pepsi is gaining in zero sugar and in restaurant reach, and both companies are racing into functional soda. Tastewise shows those shifts across menus, shelves and consumers every month.
Frequently asked questions about coca cola vs pepsi
Pepsi is sweeter and more citrus-forward, with 41 grams of sugar per 12-ounce can and added citric acid. Coca-Cola has 39 grams of sugar, more sodium and a vanilla and raisin profile.
The companies differ too. Coca-Cola focuses on beverages, while PepsiCo earns 58% of its revenue from food.
Coca-Cola leads. Classic Coke held 18.5% of US soda volume in 2025 and ranked first, while Pepsi ranked third behind Dr Pepper.
PepsiCo reported $93.9 billion in 2025 net revenue against $47.9 billion for Coca-Cola. PepsiCo’s total includes its snack business, which makes up 58% of revenue.
Coca-Cola shares returned about 84% over the five years to mid-September 2026, against about 3% for PepsiCo. PepsiCo offers the higher dividend yield, at about 4.2% against 2.4%.
McDonald’s, Burger King, Wendy’s and Domino’s serve Coca-Cola. Taco Bell, Pizza Hut and KFC serve Pepsi, and so does Subway since January 2025.
Pepsi reports that 66% of tasters picked Pepsi Zero Sugar over Coke Zero Sugar in its 2025 Pepsi Challenge. The test was run by Pepsi, and sip tests tend to favor the sweeter drink.
Pepsi Zero Sugar is growing faster from a smaller base. Its US volume grew 18.1% in the first nine months of 2025, against 4.8% for Coke Zero Sugar.



We’d love to learn your goals and see how Tastewise fits
We’d love to learn your goals and see how Tastewise fits
Get a personalized demo
Good taste. Wise move.
Your demo request is confirmed. We’ll reach out within one business day to schedule your walkthrough.
What happens next

See what’s driving demand, then turn it into a sell-in story for retailers and operators.
- Connect consumer panels, market trackers, and agents into one evidence view
- Get the “why” behind what’s changing, with explainable demand drivers
- Walk away with a buyer-ready narrative and next steps to activate
Trusted by


“Tastewise is my secret tool for knowing what consumers want next and why.“