






Realtime retail shelf data for food & beverage
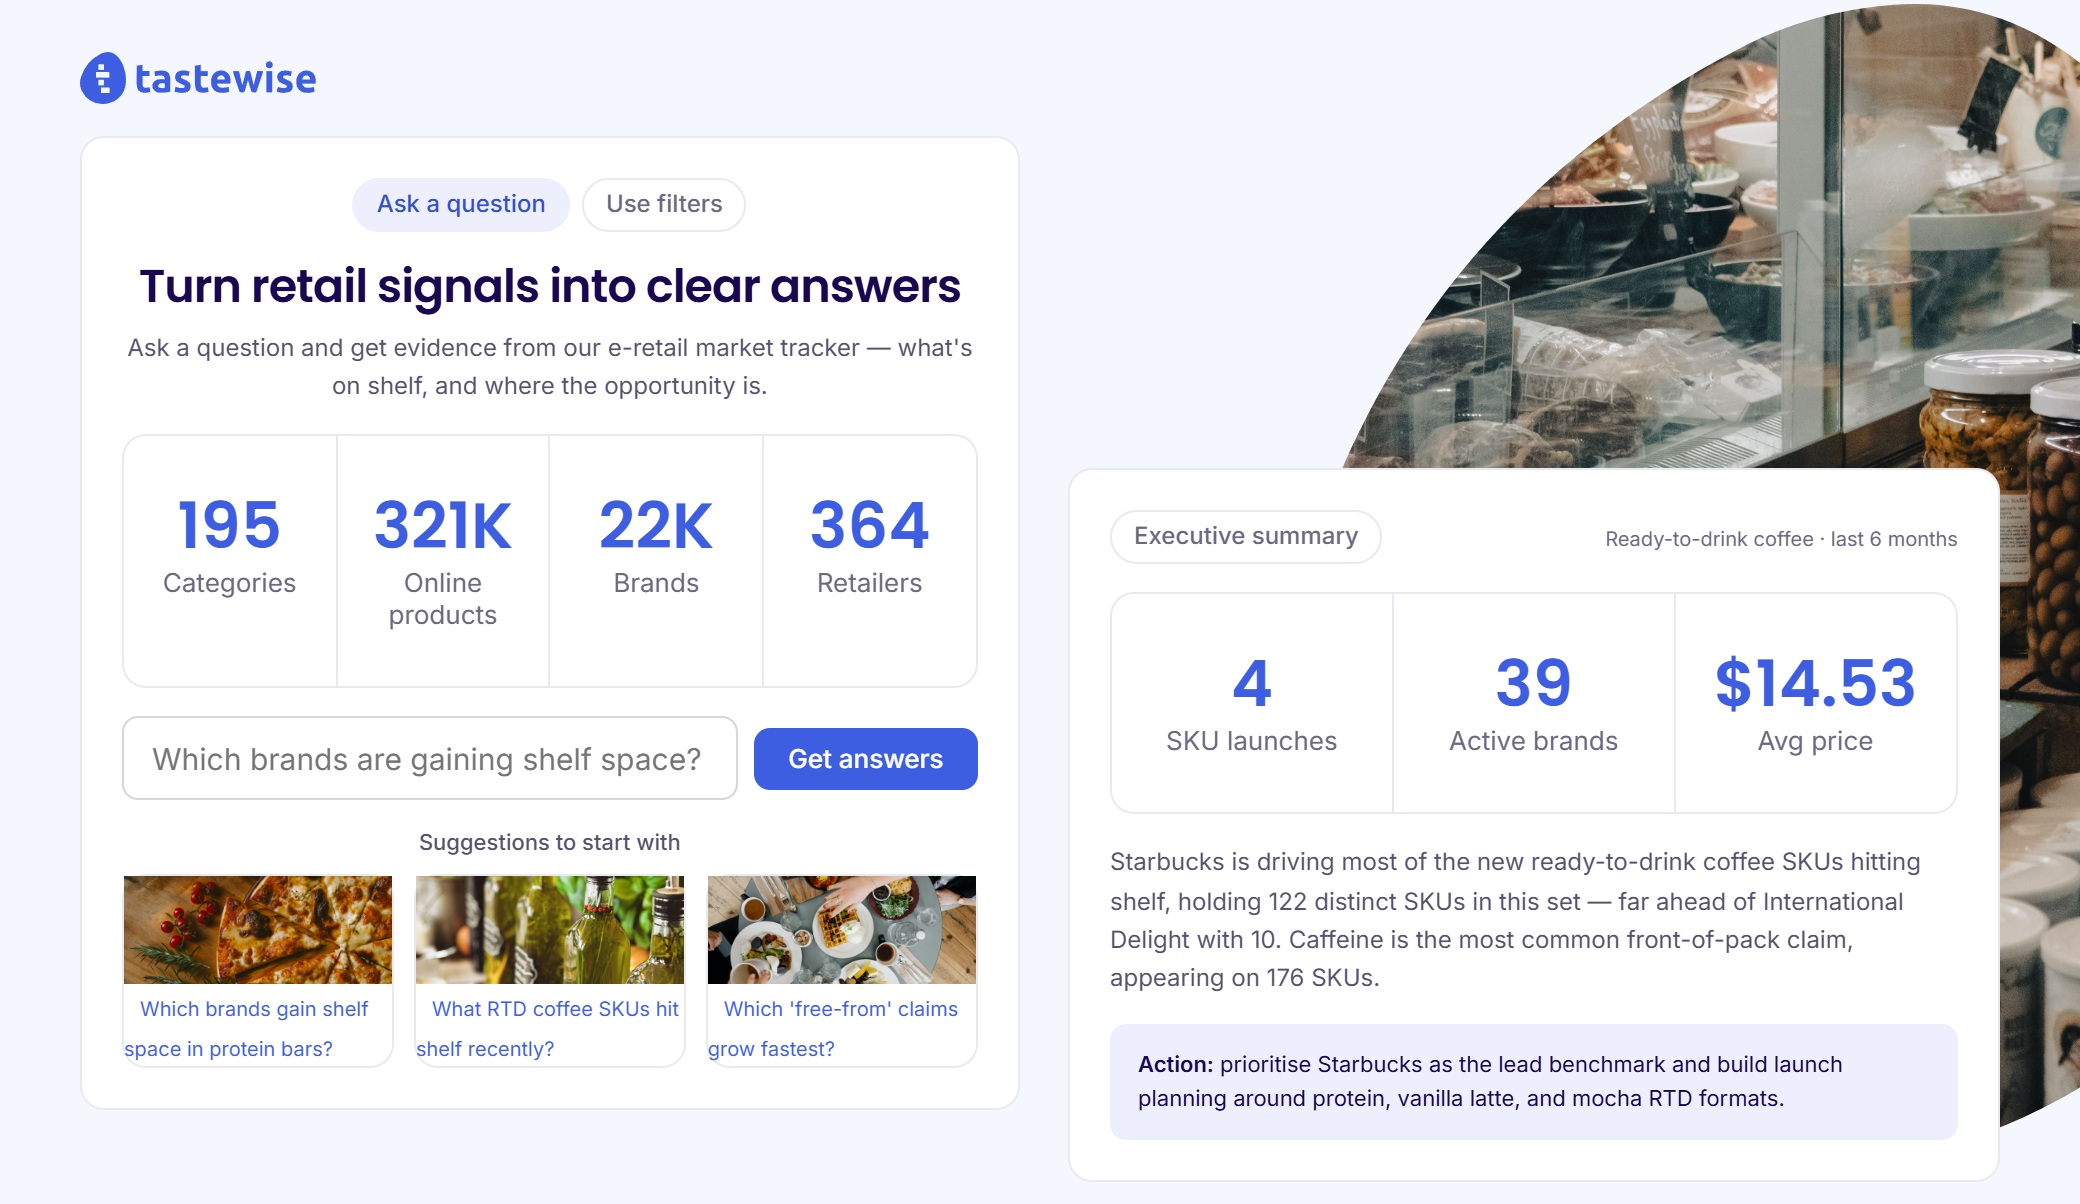
Win the retail shelf with Tastewise retail intelligence. The RETAIL DASHBOARD puts your whole category on the shelf, online and in store, in one view, so your team can track new launches, assortment, pricing and claims across 350+ US retailers. Powered by Tastewise e-Retail data, it helps you win the digital shelf and the physical shelf alike, with answers you can ask for in plain language.
Trusted by 80% of the world’s leading food & beverage brands · since 2018










Chocolate leads convenience launches, with Lindt out front
Chocolate leads new launches in convenience stores, and Lindt is ahead with the most new SKUs in boxed and bar. On the digital shelf, indulgent is the top front-of-pack claim, followed by tasty, while DoorDash holds the widest SKU footprint across the set.
Win the digital shelf, and the shelf in store
Retail intelligence built on e-Retail data. See new launches, assortment, pricing and claims across 350+ US retailers, then ask any question in plain language, from category and competitors to white-space.
Innovation and R&D
Spot new launches and the claims and formats gaining traction, so you can shape your next product around what is actually in market.
Category management
See assortment, pricing and on shelf availability across your whole category and retailer set, in one live view of retail shelf data.
Competitive intelligence
Track what competitors are launching and what their shelf presence looks like across the digital shelf, retailer by retailer.
Marketing and positioning
Understand the key claims and messaging winning in your category, so you can position your brand to stand out on shelf.
Powered by Tastewise’s e-Retail data
e-Retail is the fourth major data source in Tastewise, alongside the consumer panel, the Foodservice market tracker and Non-commercial channel data. It covers 350+ retailers and around 15,000 convenience stores, sourced from Walmart, Instacart and DoorDash, so your retail shelf data stays current and defensible.
The whole digital shelf, in one project view.
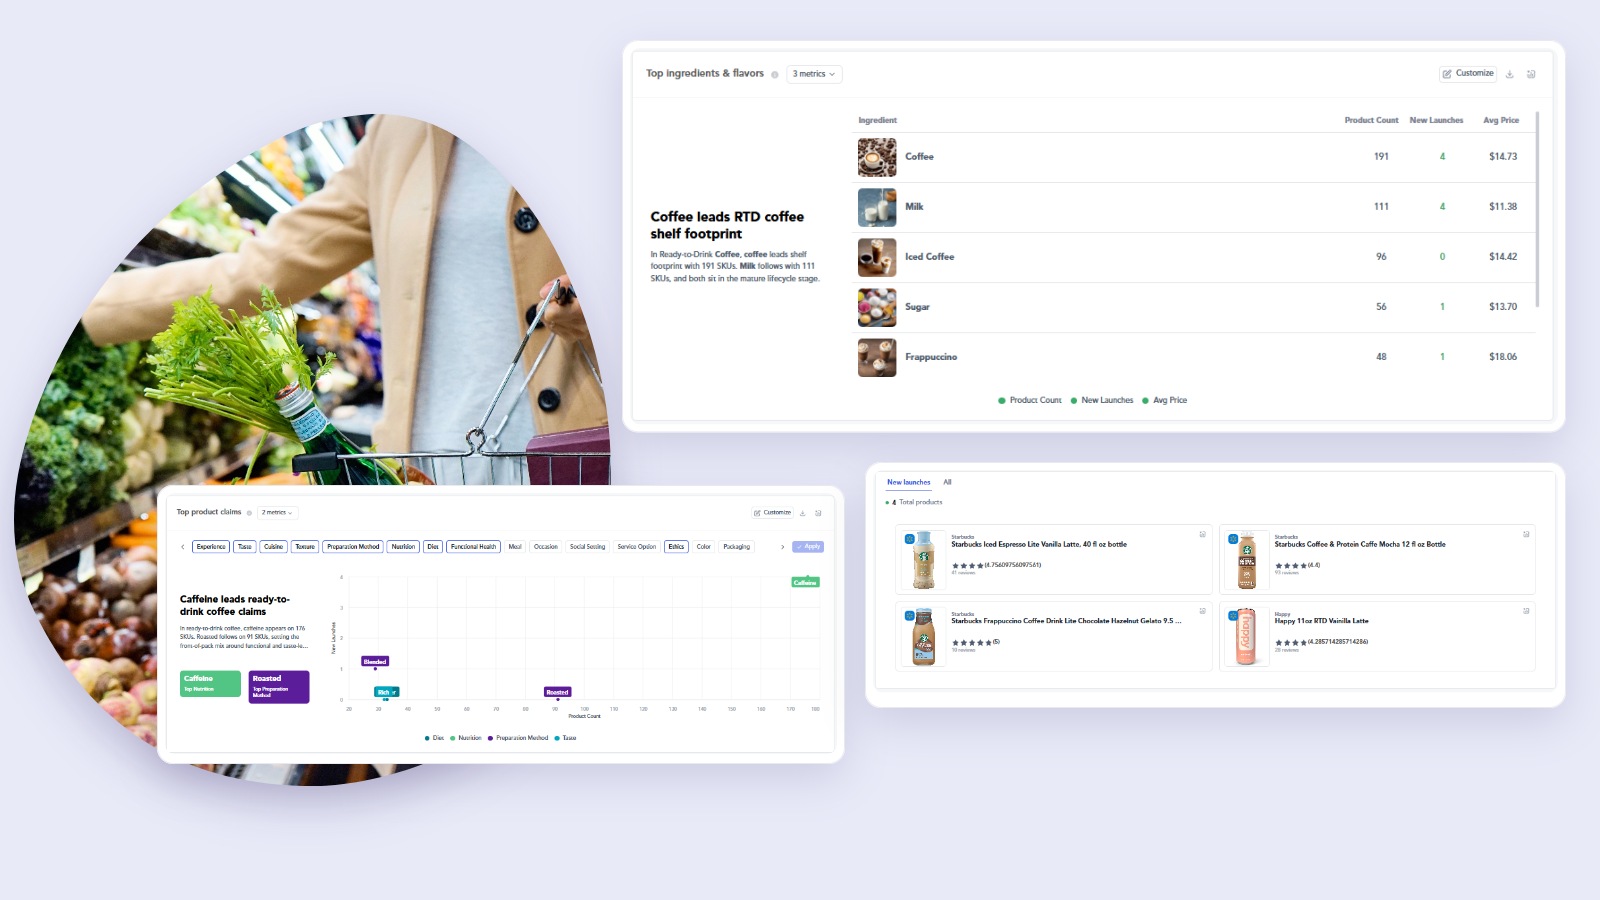
From your category to a retail answer in plain language
Three steps. One e-Retail data source. From the categories and retailers you choose to a clear answer on launches, assortment, pricing and claims.
Set your categories and retailers
Choose the categories you sell into and the retailers that matter. The Retail Dashboard maps your slice of the digital shelf.
e-Retail reads the digital shelf
e-Retail pulls live product, assortment, pricing and claims from 350+ retailers and around 15,000 convenience stores across the US.
Ask any question, get an answer
Break your category down by brand, retailer, product claims and ingredients, or just ask in plain language and get an answer built on real retail shelf data.
Tastewise’s Retail Dashboard vs manual shelf checks
Without the Retail Dashboard
- Launch and assortment news that arrives weeks late
- No view of live assortment, pricing or claims
- Hours of manual store visits and site checks
- “We think a competitor launched something”
- The same blind spot across every retailer
With the Tastewise Retail Dashboard
- A live view of new launches and assortment on shelf
- Pricing, claims and white-space across your whole category
- Any question answered in plain language, ready to share
- “Here’s what launched, at what price, with which claims”
- One dashboard across 350+ US retailers
How brands shaping modern F&B decisions use Tastewise
From weeks-late launch news to same-week visibility.
Competitor launches spotted in store, weeks after the fact.
New launches surfaced from e-Retail data in week one.
From stale syndicated data to live retail shelf analytics.
Category reviews built on stale syndicated data.
Live assortment and pricing, sourced and ready for the room.
From guesswork on claims to what is actually winning.
Positioning built on hunches about the category.
The claims and messaging gaining traction, from real shelf data.
More AI agents and solutions for food & beverage teams
The Retail Dashboard and New Product Launches tracker are two of the Tastewise solutions and agents. Each runs on the same validated F&B data, from retail shelf analytics to operator-level sell-in intelligence.
Marketing Agent
Build data-backed marketing strategies grounded in real consumer behavior and trend signals.
TradeShow Intelligence
Track competitor launches, innovation themes and buyer signals from industry events.
LTO Innovator
Design limited-time offers optimised for menu impact and consumer excitement.
Brand Navigator
Map brand portfolio health, competitive positioning and white space at a glance.
Blog Post Creator
Produce SEO-ready food editorial content backed by real trend and consumer signals.
Product Visualizer
Generate AI-rendered product imagery for concepts and campaigns before production.
Foodtok Growth Signals
Capture viral TikTok food moments and translate creator trends into activation ideas.
Recipe Innovation
Develop trend-grounded recipe concepts tuned for operator and retail channel fit.
Synthetic Survey Agent
Runs panels on-demand to validate concepts with target audiences.
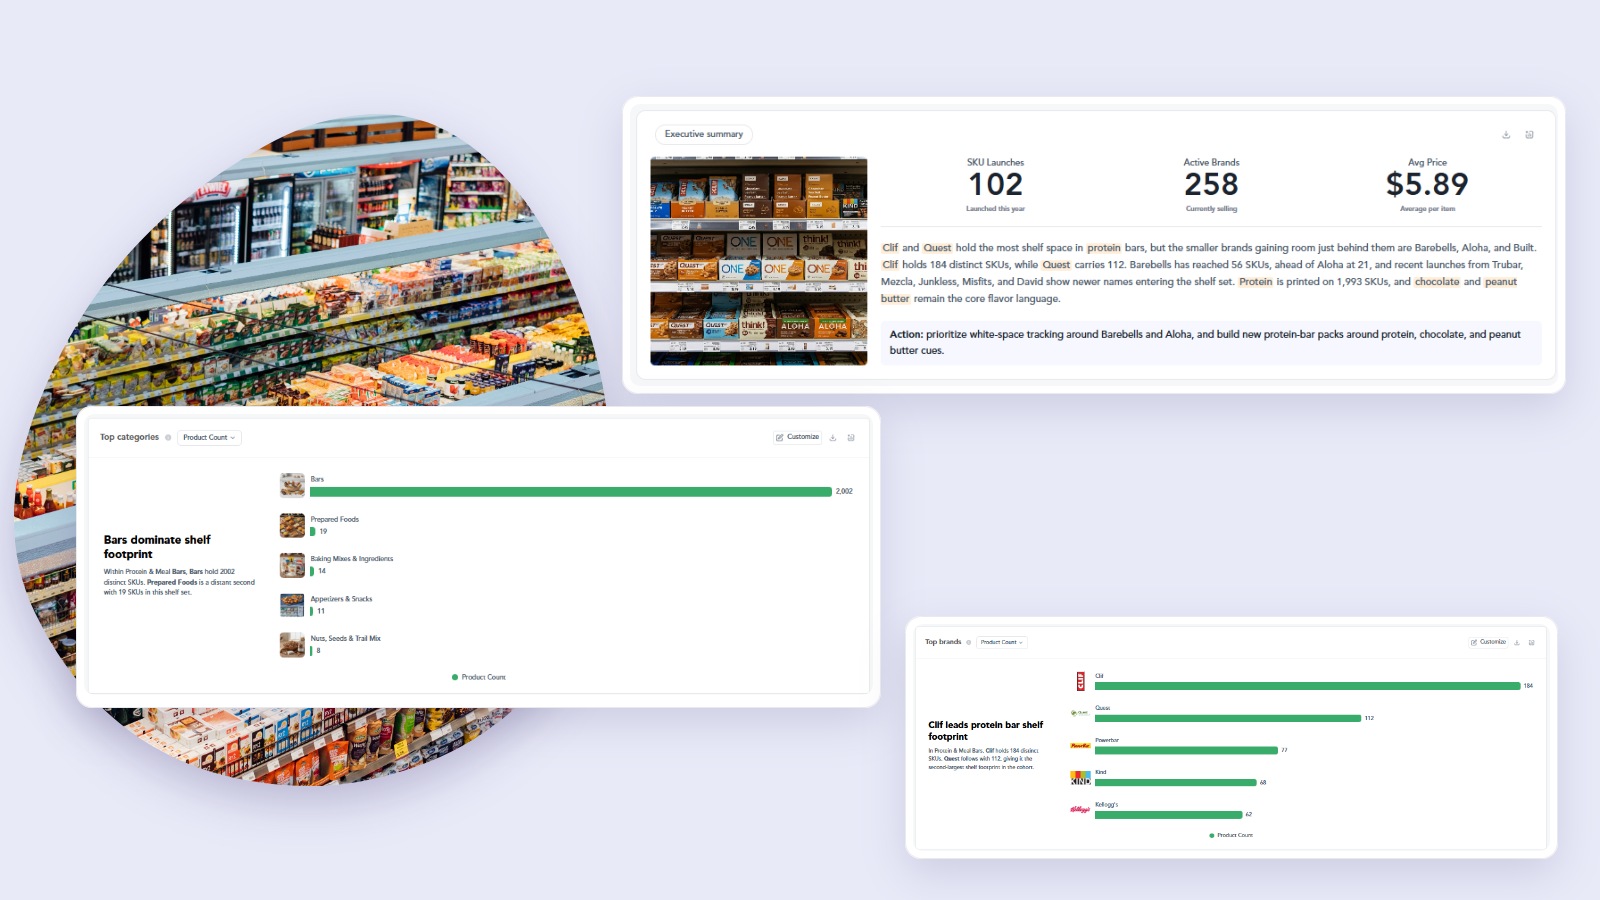
Ready to see the Retail Dashboard in action?
80% of leading food brands use Tastewise to win the digital shelf. Book a session and see the Retail Dashboard and New Product Launches tracker set up for your categories and retailers.
FAQs about winning the shelf
What is the Tastewise Retail Dashboard?
The Retail Dashboard is a Tastewise solution that puts your whole category on the digital shelf. Powered by e-Retail data, it shows new launches, assortment, pricing and claims across 350+ US retailers, and you can ask any question in plain language, from category and competitors to white-space.
What is e-Retail?
e-Retail is the fourth major data source in Tastewise, alongside the consumer panel, the Foodservice market tracker and Non-commercial channel data. It covers 350+ retailers and around 15,000 convenience stores, sourced from Walmart, Instacart and DoorDash.
What retail shelf analytics can I get from the dashboard?
It supports four areas: -Innovation and R&D can spot new launches and the claims and formats gaining traction. -Category management can see assortment and pricing. -Competitive intelligence shows what rivals are launching and their shelf presence. -Marketing can read the key claims and messaging winning in a category.
Does it track new product launches?
Yes. The New Product Launches tracker is the second e-Retail agent. It surfaces new products hitting the digital shelf, so innovation and R&D teams can see the claims and formats gaining traction and shape their next launch around what is already in market.
How do I ask questions in the dashboard?
The e-Retail Dashboard supports natural-language querying. Ask about category, competitors, claims or white-space in plain language and get an answer built on live retail shelf data, with no query building required.
How is this different from a generic shelf monitoring tool?
Most shelf monitoring tools are built for horizontal retail with no food and beverage context. The Retail Dashboard runs on the Tastewise food-data layer, so every answer is grounded in real F&B categories, real retailer shelves and the trends driving consumer demand, not generic price scraping.
How do I get access?
e-Retail is a purchasable data source under Tastewise token pricing, available now for US customers. Book a demo and you can unlock both the Retail Dashboard and the New Product Launches tracker, in the marketplace and in the dashboard sidebar.





