





Key consumer insights are the reasons behind what people eat, drink and buy. They are the difference between a product that moves off shelf and one that gets delisted in two quarters. For food and beverage teams, the hard part is rarely collecting data. It is separating a passing spike from a durable shift in demand.
This guide covers what a key consumer insight actually is, where to find one, the eight that matter most in food and beverage right now, and how to turn each into a decision your team can act on. Every Tastewise figure below describes conversation and menu activity in the US market over the past 12 months. Those figures measure demand signal, not sales or household penetration.
Key takeaways
- Fiber is the fastest-moving functional claim in US food and beverage. Fiber conversation grew 11.3% in the past year, and restaurant dishes carrying it grew 33.5%.
- Protein now reads as table stakes. High protein appears in roughly 22% of US protein conversation, and protein claims appear in 47% of fiber conversation, so the two travel together.
- Metabolic framing is where health is growing. Blood sugar mentions rose 14.9% inside protein conversation and metabolism rose 8.4%, while weight management fell 33.6%.
- Convenience behaves like a health claim. Convenient rose 9.3% and everyday rose 16.3% inside fiber conversation.
- Formats move faster than ingredients. Proffee, the protein coffee format, grew 17.7% and holds a 4.2% menu share while protein powder conversation fell 25.4%.
- Menus lead retail. Restaurant dishes containing protein grew 21.5% in the past year, which gives category teams an early read on what belongs on shelf.
What are key consumer insights?
A key consumer insight is an explanation of behavior that is specific enough to change a decision. It names who is doing something, what they are doing, and the need driving it. Data on its own does not qualify. “Shoppers buy high protein snacks” is data. “Shoppers reach for high protein snacks in the late afternoon because they want to hold off dinner cravings” is an insight, because it tells you the format, the daypart and the claim to lead with.
Every useful key consumer insight carries three parts. There is a behavior, a motivation, and a context that bounds it. The context is the part teams skip most often. A signal that reaches 20% of coffee drinkers is a different commercial story from one that reaches 20% of all consumers, and consumer market insights are only credible when the denominator is stated.
How to find key consumer insights
Strong insight work triangulates across sources rather than trusting one. Social conversation shows you emerging language and format experiments. Menus show you what operators have already committed to printing and pricing. Recipes show intent at home. Retail listings show what made it to shelf. Search volume shows active demand. Surveys and on-demand consumer panels close the gap when you need a direct answer on price, pack or claim wording.
Two habits separate teams that get value from teams that collect dashboards. The first is defining the audience and category before pulling anything, so every number has a stated universe. The second is checking velocity and reach together. A claim growing 40% that reaches 1% of the category is a watch item, and a claim growing 5% that reaches a third of it is a reformulation brief. A live food trends tracker handles the first read, and analytics for CPG companies handles the sizing.
Eight key consumer insights shaping food and beverage demand
These eight are drawn from Tastewise US data across food and restaurant sources over the past 12 months. Each one comes with the decision it should trigger.
Insight 1: fiber has become the headline functional claim
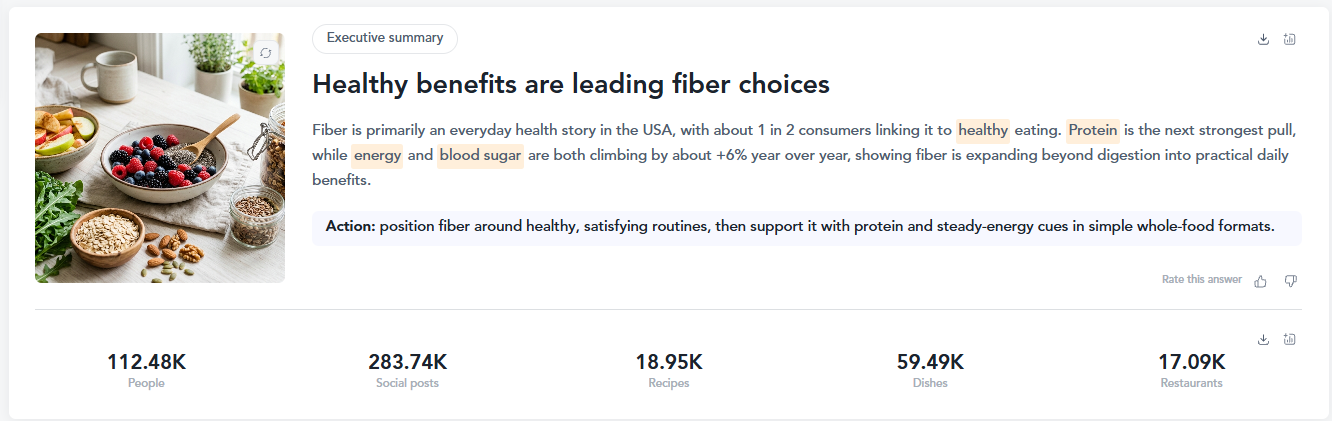
Fiber conversation grew 11.3% in the past year, and restaurant dishes carrying a fiber signal grew 33.5%. Protein appears in 47% of that fiber conversation, so the winning products pair the two rather than choosing between them. Gut health sits at 27% of fiber conversation. If you sell bars, cereal, yogurt or beverages, the near-term move is a dual protein and fiber callout rather than a fiber-only line extension.
Insight 2: metabolic language is where health is growing
Inside protein conversation, blood sugar rose 14.9% and metabolism rose 8.4%, while weight management fell 33.6% and low calorie fell 29.1%. Consumers have swapped restriction language for regulation language. Smoothie King already prices a Gladiator GLP Chocolate smoothie at $9.20 and a Metabolism Boost Dark Chocolate Banana smoothie at $10.07. Audit your pack copy for calorie-led claims and test blood sugar and steady energy framing against them.
Insight 3: convenience now performs as a health claim
Convenient rose 9.3% inside fiber conversation, easy rose 14.4% and everyday rose 16.3%. Consumers treat repeatability as part of whether a product is good for them. That is why Starbucks Egg White and Roasted Red Pepper Egg Bites hold a $7.25 price point in a category that used to compete on nutrition panels alone. Lead with the two-minute occasion, then support it with the nutrition claim.
Insight 4: formats travel faster than ingredients
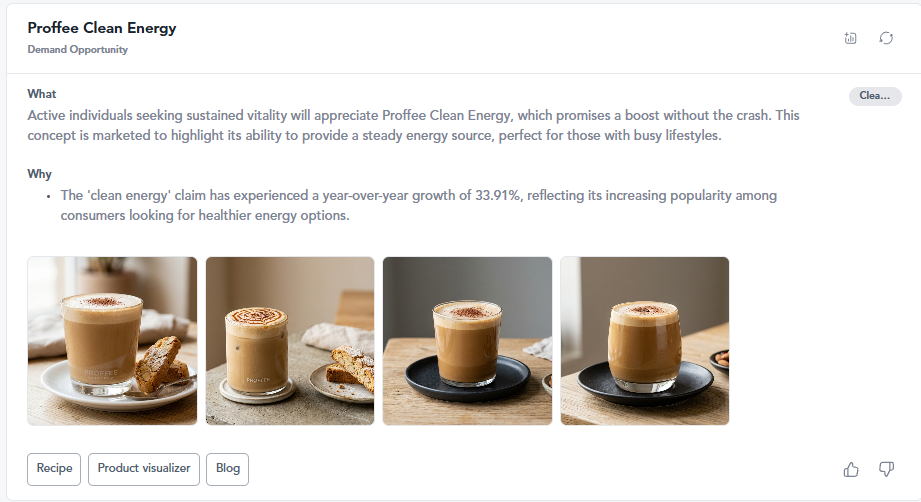
Protein powder conversation fell 25.4% and whey protein fell 24.8%, while proffee, the protein coffee format, grew 17.7% and holds a 4.2% menu share. The ingredient is mature and the format is early. Starbucks sells a Sugar Free Vanilla Protein Matcha at $7.25, which puts a functional claim inside a drink people already order daily. Your fastest route to growth is usually a new format for a familiar ingredient.
Insight 5: menus are the leading indicator for retail
Restaurant dishes containing protein grew 21.5% in the past year, ahead of the 5.7% growth in protein conversation. Operators commit earlier than category buyers because an LTO is cheaper to test than a SKU. Chipotle, Smoothie King, Starbucks, Nekter Juice Bar and Playa Bowls lead fiber execution today. Bring that menu evidence into retail sell-in conversations, because it answers the buyer question of whether anyone is actually ordering this.
Insight 6: comfort and health travel together
Comfort rose 46.8% inside protein conversation, soft rose 43.2%, creamy rose 18.7% and dessert rose 14.6%. The same shopper buying a fiber cereal wants a dessert-forward flavor on it. Texture and indulgence cues carry functional products rather than diluting them. Test creamy, layered and dessert-coded flavor systems on your next functional launch before you test another clean-label callout.
Insight 7: at-home and restaurant demand pull in different directions
The split inside the same data tells you where a claim belongs. Blood sugar skews heavily at-home, at 71% of its mentions, which makes it a packaging and retail media claim. Spicy, grilled and weekend all skew to restaurants at roughly two thirds of their mentions, which makes them foodservice occasions. Map your claims to the channel that already owns them, then use consumer segments to check the audience underneath each one.
Insight 8: insights decay, so build a refresh cadence
Keto fell 38.4%, clean eating fell 31.5%, vegan fell 30.6% and whole grains fell 31.5% inside the same conversation where fiber and blood sugar climbed. A claim set built two years ago is now working against the market. Re-run your core claim list every quarter and retire anything that has declined for two consecutive reads.
Practical consumer insights examples for F&B brands
The examples of consumer insights below show how raw signal becomes a decision. Each one follows the same path, from a pattern in the data to a named change in product, pack or pitch. Useful consumer insight examples always end with an action rather than an observation.
A fiber walkthrough, from social signal to menu to shelf
Start with the shift. Fiber conversation is up 11.3% while high fiber as a stated claim is down 3.7%. Read together, those two numbers say consumers want the benefit and have stopped responding to the label. Move to menus and the picture sharpens. Magnesium holds an 8.8% menu share within fiber-related items, chia holds 2.1% and dates hold 3.1%, so operators are delivering fiber through recognizable whole ingredients rather than added fiber blends.
Then look at who has not moved. Kung Fu Tea, Subway and The Human Bean show the largest fiber whitespace across tracked chains, which makes them the operator targets for a fiber-forward beverage or breakfast concept. That is a complete key consumer insight example. It names the shift, the delivery format consumers accept, and the account to call.
Consumer goods insights that change a product decision
The key insights examples below come from fast-moving consumer goods. Consumer demand insights earn their keep at three moments. In reformulation, the protein data says the growth is in blood sugar and metabolism language rather than another gram of protein, so the brief becomes a fiber and protein pairing with a steady energy claim. In positioning, the at-home skew on blood sugar tells you to put that claim on pack and keep spice and weekend cues for foodservice. In packaging, the collapse in keto and clean eating language tells you which front-of-pack callouts to retire. These are the key marketing insights that stop a launch from arguing yesterday’s case, and they feed directly into product innovation and consumer marketing planning.
External research backs the direction. A Purdue University consumer survey found that 29% of US adults set a food or nutrition goal for 2026, and most of that group planned to cut processed foods. Pair that with the shift toward CPG ecommerce, where claims have to work as search terms rather than shelf glances, and the case for whole-ingredient fiber delivery gets stronger.
Why key consumer insights matter for growth
Three returns come from doing this well. Product teams cut the cost of being wrong, because a concept is tested against demand before the trial run. Marketing teams write to a need that already exists, which lifts relevance without lifting spend. Sales teams walk into a buyer meeting with menu evidence rather than an opinion. The 2026 trend forecast is a useful benchmark for where your category sits against the wider market.
Turning key consumer insights into your next launch
Pick one claim, one format and one channel from the eight insights above and test them together this quarter. Fiber paired with protein, delivered through a familiar format, framed around steady energy rather than restriction, is the highest-probability starting point in US food and beverage right now. Then set a quarterly re-read so the claim set stays current as the language shifts again.
Frequently asked questions about key consumer insights
Combine real-time behavioral sources with direct research. AI trend platforms, social listening, menu data and search analytics show you what people are already doing. Surveys, focus groups and POS data confirm why and at what price. Analyzing several channels together is the fastest route to a usable answer, because a single source cannot tell you whether a signal like fiber is growing at home, on menus or both.
Examples include the shift from restriction to regulation language, where blood sugar mentions rose 14.9% while weight management fell 33.6%, and the rise of format-led innovation, where proffee grew 17.7% as protein powder fell 25.4%. Each one names a behavior, a driver and a decision.
Use them to sequence decisions. Insights tell you which claim to lead with, which format to build it into and which channel to launch it in. Restaurant dishes containing protein grew 21.5% in the past year, which is the kind of read that lets a category team time a retail launch behind proven menu demand.
They replace assumptions with evidence about what consumers currently respond to. Convenient rose 9.3% and everyday rose 16.3% inside fiber conversation, which tells a marketing team to lead with the daily occasion and support with nutrition. Messaging built on last year’s claim set works against the market.





We’d love to learn your goals and see how Tastewise fits
We’d love to learn your goals and see how Tastewise fits
Get a personalized demo
Good taste. Wise move.
Your demo request is confirmed. We’ll reach out within one business day to schedule your walkthrough.
What happens next

See what’s driving demand, then turn it into a sell-in story for retailers and operators.
- Connect consumer panels, market trackers, and agents into one evidence view
- Get the “why” behind what’s changing, with explainable demand drivers
- Walk away with a buyer-ready narrative and next steps to activate
Trusted by





“Tastewise is my secret tool for knowing what consumers want next and why.“