





CPG pricing strategy built on farm to shelf data
Shelf Signal reads the USDA Food Price Outlook and shows you whether your input costs are moving faster than your shelf prices, and whether the forecast is worth planning against.
Trusted by 80% of the world’s leading food & beverage brands · since 2018
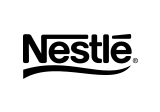




Hold price. Farm milk is down 33.3% while retail dairy sits flat at 0.1%.
Inputs are falling faster than shelf prices, which is a margin expansion window rather than a price increase window. Wholesale dairy is down 7.4% across the same period. Holding or trimming shelf price protects volume while your cost of goods drops.
CPG pricing strategy decisions you can make the same day
Four questions Shelf Signal answers before your next pricing review.
Price moves timed to cost
See whether inputs are falling faster than your shelf price, so you take price while the window is open.
Squeeze spotted early
Catch input costs climbing faster than retail can absorb, before the gap reaches your margin.
A forecast you can plan on
Check how often the USDA band has held for your category before you build the number into a plan.
One page for the line review
Take a printable position on your category into the room, sourced and dated.
Powered by Tastewise’s real-time food data
Shelf Signal runs on the USDA Economic Research Service Food Price Outlook, the official US series covering food at home and the categories beneath it. It reads three price levels for each one, farm, wholesale and retail, then compares how far each has moved.
Behind every signal
CPG pricing strategy in three steps
Pick a category, read the spread, take the position into the room.
Pick your category
Choose from the USDA hierarchy, from all food down to the shelf you own.
Read the spread
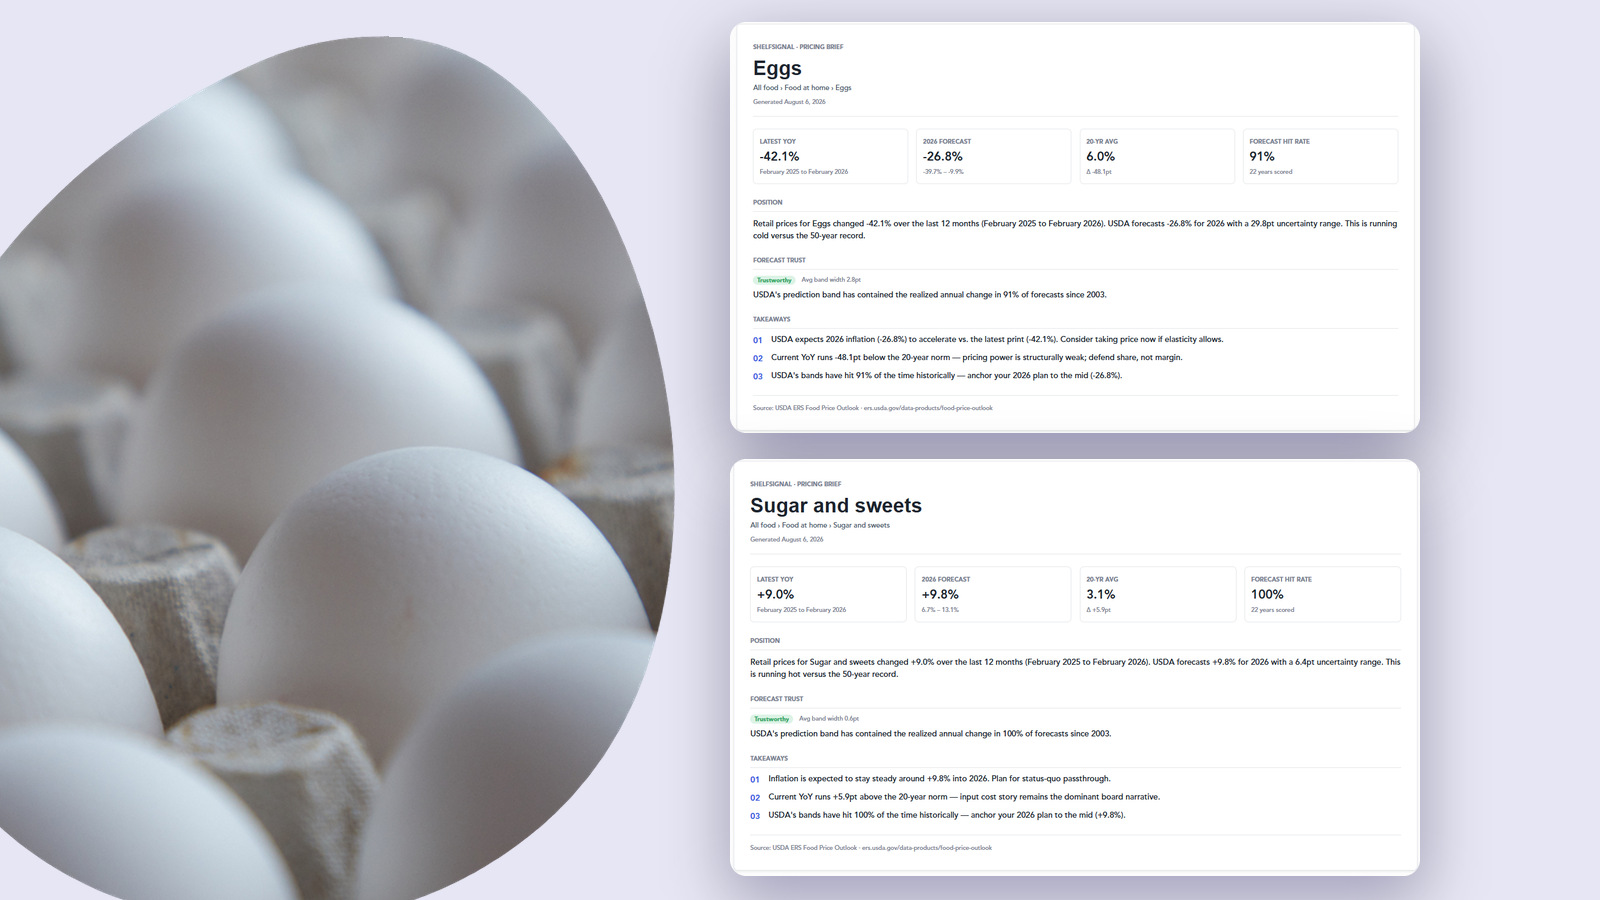
Margin Radar compares farm, wholesale and retail movement and flags the signal.
Take the position
The Executive Brief prints the number, the range and three takeaways for your review.
CPG pricing strategy with and without the spread
Without Tastewise’s Shelf Signal
- One national inflation figure for every category
- Input costs arrive from procurement, weeks late
- No way to tell a squeeze from a margin window
- Forecasts taken on trust
- A slide rebuilt by hand before every review
With Tastewise’s Shelf Signal
- A figure for your category and the ones beside it
- Farm, wholesale and retail movement side by side
- A computed signal at five points of separation
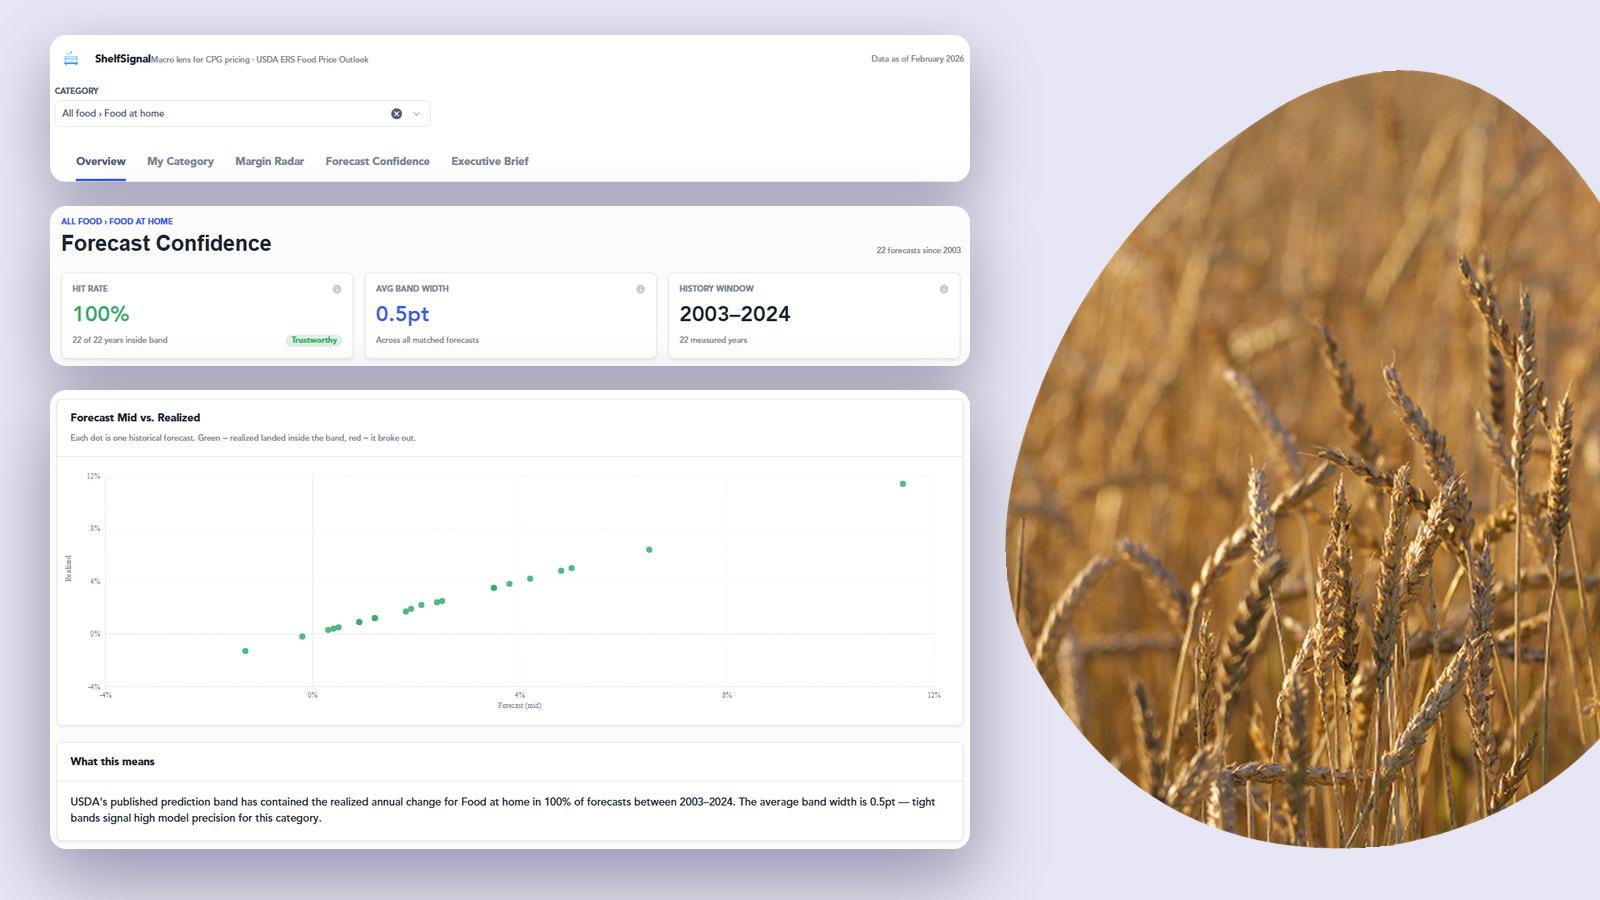
- Forecast accuracy scored across 22 years
- A printable one page position per category
How brands shaping modern F&B decisions use Tastewise
From annual price letter to timed price moves
Price decisions set once a year against a national inflation figure.
Category level windows spotted while they are still open.
From defending a number to showing the spread
The retailer pushes back and the argument rests on general cost inflation.
Farm to shelf movement for the category, dated and sourced.
From a forecast taken on faith to one with a track record
A plan built on a published number with no sense of how reliable it is.
The same number carrying 22 years of scored accuracy.
More AI agents for food & beverage teams
The AI Sales Story Creator Agent is one of the Tastewise agent family. Each runs on the same validated F&B data, from AI sales forecasting food and beverage teams rely on, to operator-level sell-in intelligence.
Marketing Agent
Build data-backed marketing strategies grounded in real consumer behavior and trend signals.
TradeShow Intelligence
Track competitor launches, innovation themes and buyer signals from industry events.
LTO Innovator
Design limited-time offers optimised for menu impact and consumer excitement.
Brand Navigator
Map brand portfolio health, competitive positioning and white space at a glance.
Blog Post Creator
Produce SEO-ready food editorial content backed by real trend and consumer signals.
Product Visualizer
Generate AI-rendered product imagery for concepts and campaigns before production.
Foodtok Growth Signals
Capture viral TikTok food moments and translate creator trends into activation ideas.
Recipe Innovation
Develop trend-grounded recipe concepts tuned for operator and retail channel fit.
Synthetic Survey Agent
Runs panels on-demand to validate concepts with target audiences.
Ready to see this agent in action?
80% of leading food brands use Tastewise to turn signal into revenue. Book a session and get Shelf Signal built around your category and your pricing calendar.
FAQ
What is Shelf Signal and how does it support a CPG pricing strategy?
Shelf Signal is a macro lens on food pricing inside the Tastewise platform. It turns the USDA Food Price Outlook into three answers a pricing team needs, whether to take price, whether inputs are about to squeeze you, and how much the forecast can be trusted. You pick a category and it returns the position, the signal and a printable summary.
Where does the data behind the CPG pricing strategy signals come from?
Every number comes from the USDA Economic Research Service Food Price Outlook, a public federal series published since 2003. Shelf Signal reads the farm, wholesale and retail price series for each category and compares their movement. The source and the data date are printed on every view, so anything you take into a meeting can be traced back.
How does Shelf Signal decide which CPG pricing strategy signal to show?
Four rules, applied to the gap between input and retail movement. Upstream squeeze fires when inputs run more than five points ahead of retail. Margin expansion fires when retail runs more than five points ahead of inputs. Retail lagging fires when both move the same way but retail captures less than half the input move, and aligned means the two sit within three points of each other.
Why not just ask ChatGPT to help with a CPG pricing strategy?
A general model will give you the national headline figure, which is the same number for every category you sell into. It has no view of the gap between farm and shelf in your category, and no record of whether the published forecast has held before. ShelfSignal computes the spread and scores the forecast, so the output is a position rather than a summary.
Which categories does the CPG pricing strategy view cover?
The USDA hierarchy, from all food down through food at home to the individual categories beneath it. That covers eggs and dairy, beef and poultry, cereals and bakery, plus sugar and sweets and nonalcoholic beverages. You select a category once and every view follows it, each with its own forecast and its own accuracy record.
Is ShelfSignal ready for enterprise CPG pricing strategy teams?
It sits inside the Tastewise platform alongside the agents your teams already use, under the same access controls and the same contract. The underlying series is public federal data, so there is nothing proprietary to clear with procurement or legal. The Executive Brief exports as a print ready page for circulation.
Does a CPG pricing strategy built on USDA data work outside the US?
The Food Price Outlook is a United States series, so ShelfSignal reports US farm, wholesale and retail movement. Teams working other markets use it for the US portfolio and for the input cost picture, which often moves ahead of local retail. Talk to us about coverage if you need a view on another market.





