


Onigiri trends are consolidating around formats that support repeat usage, operational efficiency, and clear pricing logic. Tastewise evidence shows demand reinforcing through menu placement and everyday consumption occasions, creating a defendable case for scale across foodservice and adjacent channels.
Onigiri trends overview
- +55.6% YoY growth in Foodservice menu share vs +20.8% YoY social growth
- 43% of demand tied to “Asian” need-state; 9% to convenience
- Protein leads: fish 26%, salmon 11%, tuna 10%, chicken 9.7%
- Flavor accents grow fast off small bases: lemongrass +207% YoY
- Menu pricing clusters at $5–$10, led by fast casual
Demand is concentrating through menu execution
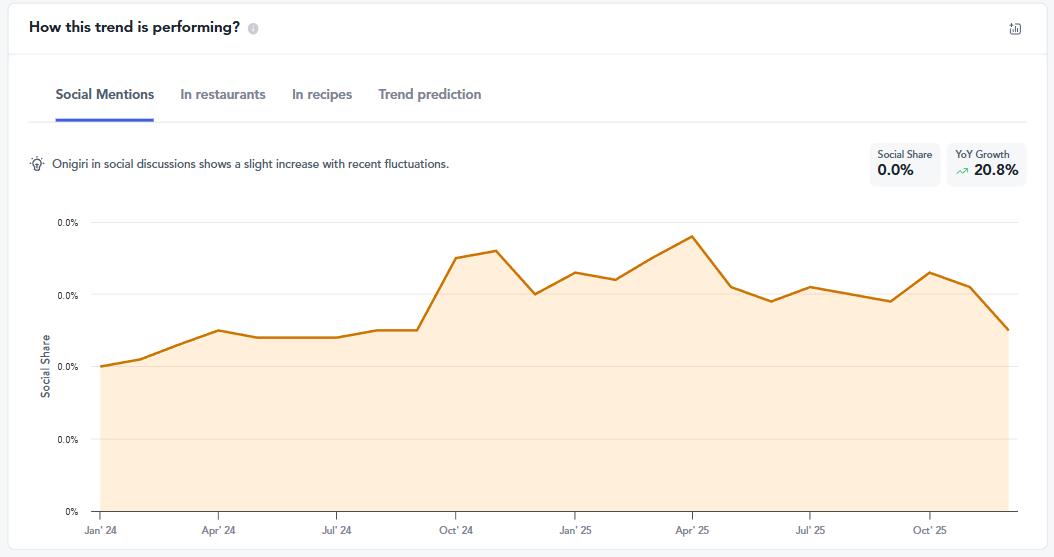
According to the Social F&B panel, onigiri mentions are up +20.8% YoY, with visible month-to-month fluctuation. Foodservice data shows a different pattern: operator menu share is up +55.6% YoY and holding around 0.2% with recent stability.
That difference matters. Social activity reflects awareness, but menu share reflects commitment. Onigiri trends are being validated where labor, sourcing, and throughput decisions are already locked in, which changes how teams should evaluate risk. Foodservice performance becomes the stronger proof point for internal alignment and external sell-in.
Convenience-led Asian formats dominate the need-state
According to the Social F&B panel, “Asian” accounts for 43% of associated needs, followed by “tasty” (19%) and “convenient” (9%). Attributes tied to indulgence or experimentation sit well behind.
This distribution shows that onigiri trends are anchored in familiarity and speed. Consumers are choosing the format for reliable, low-friction eating occasions rather than discovery. Positioning the product as portable, filling, and recognisable aligns more closely with how demand is forming than rotating through aggressive flavour innovation.
Protein-forward fillings anchor repeat demand
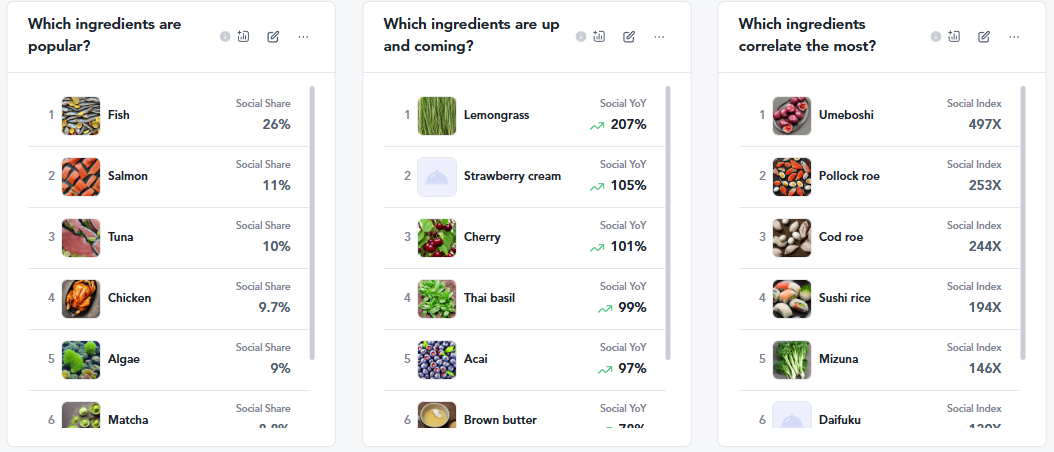
Ingredient popularity data shows fish (26%), salmon (11%), tuna (10%), and chicken (9.7%) leading social share. These proteins also sit within mature or trending lifecycle stages, supporting consistency and supply stability.
Growth signals appear in flavor accents such as lemongrass (+207% YoY) and strawberry cream (+105% YoY), but from smaller bases. The structure is clear: core proteins establish trust and frequency, while secondary flavors refresh interest without disrupting the base offer. Onigiri trends benefit when innovation rotates around the protein, not away from it.
If you’re planning to scale onigiri in 2026, the challenge isn’t the product, it’s proving demand, pricing logic, and shelf fit to buyers. Our Winning the Shelf Playbook shows how to turn demand signals into a clear replacement story retailers can say yes to.
Preparation methods support operational scale
Consumption moments consistently surface grilled and wrapped formats, including yaki onigiri and seaweed-wrapped rice balls. These preparations show up across social content, recipes, and menus.
The methods rely on familiar kitchen processes and limited specialised equipment. That lowers training friction and improves consistency across service windows, which makes the format easier to defend when scaling across locations or channels.
Pricing reinforces accessibility and bundling
Foodservice pricing clusters onigiri between $5 and $10, with fast casual holding the largest share and QSR gradually increasing participation. Price movement remains relatively stable across states, with limited evidence of premium drift.
This stability supports trial and repeat rather than one-off purchase behaviour. Onigiri trends perform best when priced for frequency, with bundles and multi-item formats doing the work of growing basket size instead of pushing single-item price ceilings.
Lifecycle alignment reduces execution risk
Related dishes such as sushi, noodles, curry, and ramen sit in mature lifecycle stages, alongside core ingredients like salmon, tuna, and mayo. That maturity reduces the need for consumer education and limits supply-side volatility.
Onigiri trends benefit from operating inside an established ecosystem. The primary risk is no longer consumer understanding or ingredient unfamiliarity, but execution choices around format, pricing, and placement.
FAQs about onigiri trends
dOnigiri is a rice-based format most often positioned as a portable snack, light meal, or bundle component. Foodservice data shows it performing as a flexible item that fits breakfast, lunch, and between-meal occasions without requiring a full menu reset.
According to Tastewise data, social engagement is growing, but Foodservice menu share is increasing at a faster and more stable rate. This suggests demand is being reinforced through repeat operator placement rather than short-term attention spikes.
isProtein-forward fillings lead demand. Fish, salmon, tuna, and chicken account for the largest share of engagement, while flavour accents appear as secondary signals. This pattern supports repeat behaviour and lowers execution risk.
coFoodservice pricing clusters most onigiri items between $5 and $10. This range supports frequency and bundling rather than premium positioning, making it suitable for fast casual and emerging QSR use cases.
Onigiri sits alongside mature Asian dishes such as sushi, noodles, and curry. Core ingredients and preparations are well established, which reduces consumer education needs and supports scalable execution.
Onigiri performs best as a permanent item when anchored by core protein fillings and familiar preparations. Limited-time rotations are more effective when used for flavour accents rather than as the primary demand driver.

Read more from Kelia Losa Reinoso

We’d love to learn your goals and see how Tastewise fits
We’d love to learn your goals and see how Tastewise fits
Get a personalized demo
Good taste. Wise move.
Your demo request is confirmed. We’ll reach out within one business day to schedule your walkthrough.
What happens next

See what’s driving demand, then turn it into a sell-in story for retailers and operators.
- Connect consumer panels, market trackers, and agents into one evidence view
- Get the “why” behind what’s changing, with explainable demand drivers
- Walk away with a buyer-ready narrative and next steps to activate
Trusted by


“Tastewise is my secret tool for knowing what consumers want next and why.“